

Loudoun, Fairfax, and Prince William County CRE Overview 2020 – 2022
Loudoun County Commercial Real Estate Sales
Total CRE sales in the two periods totaled $5.4 billion, with 513 properties changing hands. The average sales price was $11.6 million, the overall $/SF paid, averaged $301.50, and the average Cap Rate distributed across all 513 sales was 5.9%. The average time on the market was 17.95 months.
Fairfax County Commercial Real Estate Sales
The total sales equaled $10.4 billion. 914 properties were sold, with an average selling price of $12.7 million and an average $/SF of $245. The average Cap Rate was 6.65% and the average time to sell was 11 months and 3 weeks.
Prince William County Commercial Real Estate Sales
Prince William County saw 420 sales totaling $3.5 billion. The average sales price was $8.7 million, and the average price paid per SF was $229. The Cap Rate distribution averaged out at 6.45%, and the average time from listing to selling was 17.6 months.
Diving into each county, we will list the stats for the period Q4 2020 to Q3 2021, then from Q4 2021 to Q3 2022. Each pair of numbers will be for those specific periods.
Loudoun County Commercial Real Estate Sales Activity Q4 2020 to Q3 2022
Sold Volume
The total of properties sold was 260 and 253 properties, respectively. The number of transactions in each year was almost identical. The total sold volume was $2.7 billion in each period. Total square footage (SF) was 10.7 million and 9.4 million.
Price Per SF
Sales Price per SF stood at an average of $238 (ranging from $4 to $2,170) with half the sales in the $140 – $280/SF range. 2021 to 2022’s numbers give us an average $/SF of $365 (ranging from $5 to $3,024) with 48.5% in the $100 to $300/SF range.
Sales to Asking Price
Sales vs Asking Price averaged -13.7% and -4.9%. An interesting spread was when the total sales in both property and dollar volume were very close.
The percentage leased at sale was 89.6% and 95.4%.
Cap Rate
Cap Rates averaged 6.1%, with 58% of sold properties lying in the 6-7% range. The second period’s Cap Rate averaged 5.7%, with 44% of sales in the 5-6% range and 30% in the 6-7% range.
Seller and Buyer Origin
2020 – 2021
52% of Sellers were national names, 34%, were foreign-based, and 14% were local. 45% were Private Sales, 27% were Institutional, 14% were REIT/Public, 8% were Owner-Operator, and 6% were Private Equity.
85% of Buyers were national names, 9% local, and 6% foreign-based. 33% were Private, 28% Institutional, 17% REIT/Public, 16% Private Equity, and 6% were Owner-Operator.
2021-2022
94% of Sellers were national names, 5% local, and 1% foreign-based. 40% of Sellers were Institutional, 31% Private, 12% REIT/Public, 11% Owner-Operator, and 6% Private Equity.
40% of Buyers were Institutional, 31% Private, 12% REIT/Public, 11% Owner-Operator, and 6% Private Equity.
Fairfax County Commercial Real Estate Sales Activity Q4 2020 to Q3 2022
Sold Volume
The total number of properties sold in each period was 417 and 497. The total sold volume in 2020-2021 was $4.3 billion and $6.1 billion in 2021 – 2022. The total SF sold was 20.1 M and 27.2 M.
Price Per SF
Sales Price per SF averaged $243 (ranging from $8 to $2,508) with 29% of sales falling in the $160 – $240/SF range. 2021 to 2022’s numbers average $247/SF (with a minimum of $3 and a max of $1,616.) 24.6% of sales were in the $140 to $210/SF range, and 26.7% in the $210 to $280/SF range.
Sales to Asking Price
Sales vs Asking Price gives us -7.4% in the first period and -7.6% in the second.
The percentage leased at sale stood at 91.4% and 91.3%.
Cap Rate
Cap Rates averaged 7.2%, with 39.5% of sold properties in the 4-6% range and 26% in the 6-8% range. During the second period, the Cap Rate averaged 6.1%, with 19% of sales in the 6-7% range and just under 30% in the 7-8% distribution.
Seller and Buyer Origin
2020 – 2021
44% of Sellers were foreign-based, 40% national names, and 16% were local. 54% were Private Sales, 22% Institutional, 14% REIT/Public, 5% Private Equity, and 5% Owner-Operator.
62% of Buyers were foreign-based, 30% national, and 8% local. 45% were Private, 19% Institutional, 15% REIT/Public, 12% Private Equity, and 9% were User.
2021-2022
89% of Sellers were national names, 10% local, and 1% foreign-based. 41% of Sellers were Private, 39% REIT/Public, 13% Institutional, 4% Private Equity, and 3% User.
32% of Buyers were Private, 31% Private Equity, 19% Institutional, 11% REIT/Public, and 7% Owner-Operator.
Prince William County Commercial Real Estate Sales Activity Q4 2020 to Q3 2022
Sold Volume
The number of sold properties totaled 211 and 209 in the two periods. 2020-2021’s total sold volume was $2 billion and 2021-2022’s total equaled $1.5 billion. The total SF sold was 5.9 M and 5.2 M.
Price Per SF
Sales Price per SF averaged out at $254 in period 1 (ranging from $3 to $4,292.) 33% of sales were in the $200-$300/SF range. 2021 to 2022’s numbers averaged $204/SF (minimum $19 and maximum $8,108.) A full 50% of sales were below $200/SF, and just about 31% were in the $200 to $400/SF range.
Sales to Asking Price
Sales vs Asking Price gives us -2.3% in the first period and +4.8% in the second.
The percentage leased at sale for each period stood at 93.4% and 92.3%.
Cap Rate
Cap Rates averaged 6.4%, with 32% of sold properties in the 4-5% range and 21% in the 5-6% range. The Cap Rate in 2021-2022 averaged 6.5%. 35% of sales were in the 7-8% range and 22% in the 6-7% range.
Seller and Buyer Origin
2020 – 2021
56% of Sellers were national names, 43% local, and 1% foreign-based. 66% were Private Sales, 14% User, 12% Institutional, 5% Private Equity, and 3% REIT/Public
73% of Buyers were national names, 26% local, and 1% foreign. 44% of Buyers were Private, 20% User, 19% Institutional, 11% REIT/Public, and 6% were Private Equity.
2021-2022
87% of Sellers were national names, 10% local, and 3% foreign. 58% of Sellers were Private, 21% REIT/Public, 13% User, 7% Private Equity, and 1% Institutional.
98% of Buyers were national names, 1% local, and 1% foreign. 49% of Buyers were Private, 24% User, 18% Institutional, 8% Private Equity, and 1% REIT/Public.
Summary Comment
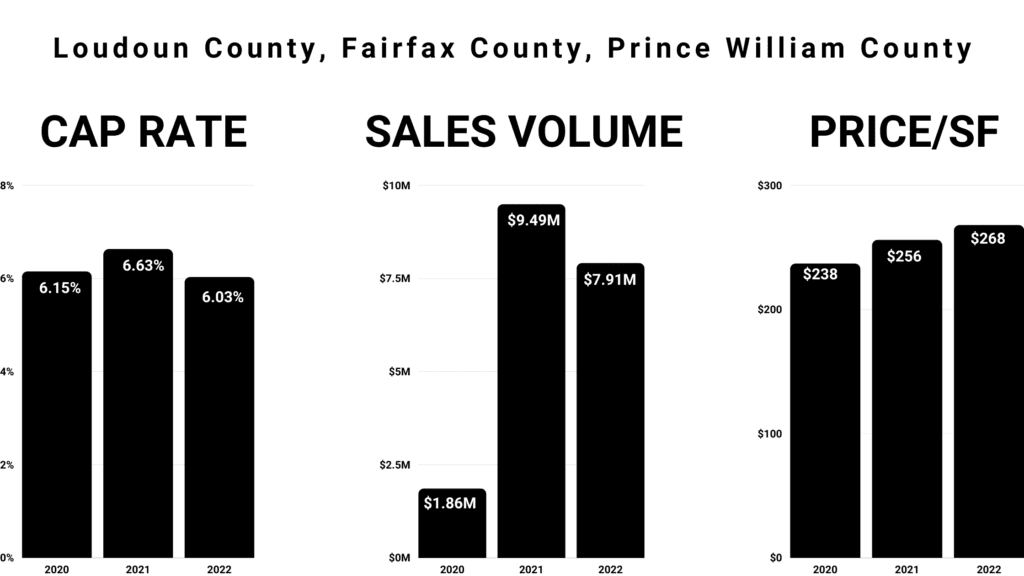
Total sales in the three counties between Q4 2020 and Q3 2022 totaled $19.3 billion. The average Cap Rate for 2020 was 6.146%, for 2021 6.631%, and for YTD in 2022, it stands at 6.034%.
Commercial real estate buyers cover the entire spectrum from local businesses to international organizations that want a Northern Virginia base. Locating appropriate buyers for specific property-types demands a sophisticated marketing strategy and a close-knit network.
Serafin Real Estate has an exemplary track record for marketing specific properties to prospective buyers who match the property type, location, and price point. If you would like to discuss how we tailor our marketing strategies to reach agreed buyer profiles, and how we work with specific buyers to locate the right property, please click here to contact us to discuss how we can be of most help.