
Northern Virginia’s Commercial Real Estate Market
Today, we will provide an overall summary of the Northern Virginia commercial real estate market, and then break down those stats across the six major sectors: multifamily, industrial, flex, office, retail, and hospitality.
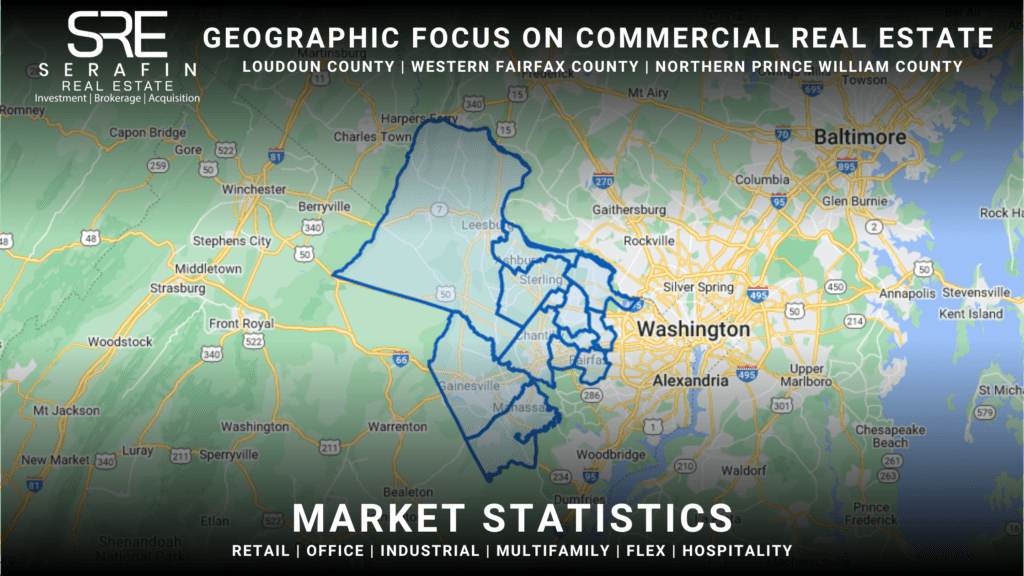
Serafin Real Estate is a premier commercial real estate brokerage in Northern Virginia with a strong focus on Loudoun County, Western Fairfax County, and North Prince William County. SRE advises, consults, and executes on both sides. We have built a reputation for selling listed properties for the highest price the market will allow and on the best terms. On the buyer side, business owners constantly work with us to find the ideal operational base for them, so they can deliver on their own specific goals, be it in the childcare, Montessori school, tech base, or warehousing market. Investors contract with us to locate, advise and negotiate on the most appropriate NNN lease income opportunities, so they can add to their portfolios.
A Whistlestop Tour of Northern Virginia
As mentioned, our niche geographical area is Northern Virginia. Before we explore the numbers, let’s take a quick peek at some of the towns and cities in Loudoun, Western Fairfax, and Northern Prince William Counties where we do business.
Loudoun County
Leesburg is the Loudoun county seat. It is home to tech entrepreneurs, designers, and artists. It was named for Robert E. Lee’s forbears and was home to General Marshall, whose Marshall Plan helped to rebuild Europe after WW2.
Sterling is famous for its high-tech centers, its modern shopping malls, and its attractive residential communities.
Ashburn is known as Data Center Alley and is North America’s top data center market, being integral to the Dulles Technology Corridor.
Purcellville is Western Loudoun County’s economic hub.
Round Hill is a beautiful spot nestled at the foothills of the Blue Ridge Mountains.
Hamilton is also a beautiful location with many of its properties being included in the National Register of Historic Places.
South Riding is unique in one particular way. Riding comes from the Viking word Threthingr, which means Third-ing or an administrative third-part. York was the Viking capital of England. They divided the county of Yorkshire into thirds. Interestingly, in Yorkshire, there was no South Riding!
Western Fairfax County
Fairfax City is known for technological innovation as well as being a center for arts and culture.
Reston is the principal city of the DC Metro Area and was America’s first, post-WW2 planned community.
Herndon is part of the Dulles Technology Corridor and is the main center for many defense and high-tech offices. And, just to follow on from South Riding, Herndon’s sister city is Runnymede in England, where King John signed what we call Magna Carta or The Great Charter. (For any history buffs reading this, in AD 1215, when he signed it, it was just called The Charter.)
Centreville boasts the Centreville Military Railroad, the first exclusively military railroad in the US.
Chantilly is home to an annex of the National Air and Space Museum.
Great Falls is famous for the Potomac’s waterfalls and rapids running through the gorge in Great Falls Park.
North Prince William County
Haymarket is considered one of the best places to live in Virginia.
Manassas has a historic heart and a modern beat!
Gainesville is famous for its shopping metropolis (Virginia Gateway) which attracts visitors from all over.
Now let’s get to the stats.
Northern Virginia’s CRE Statistical Breakdown
Northern Virginia is a major center in the USA for commerce, it offers a top-ranked workforce plus an integrated transportation network. Transportation supports continued business growth in the region as well as direct access to global markets.
 General Stats
 General Stats
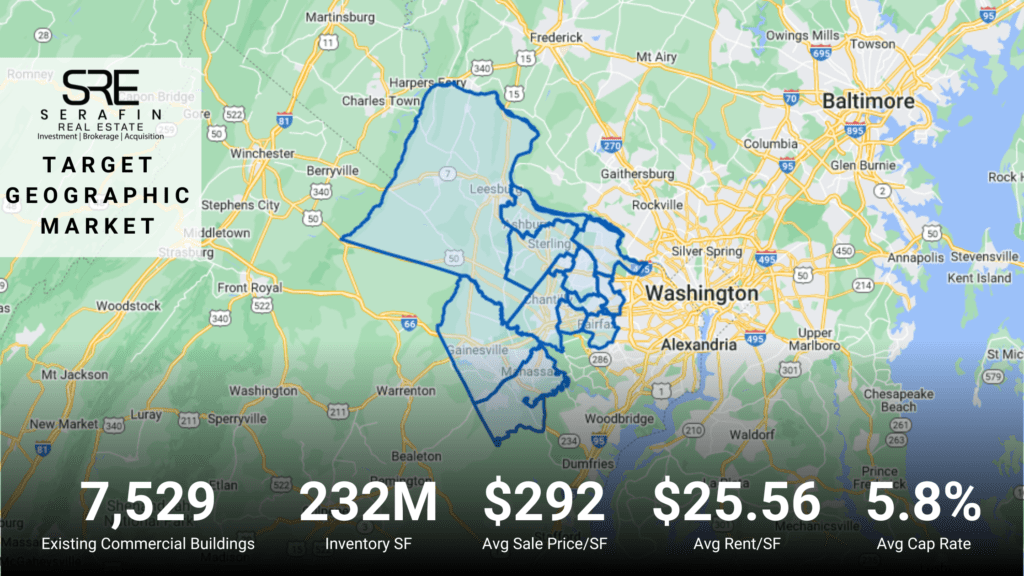
Northern Virginia’s population has grown 5.7% in the past five years. There are 7,529 existing buildings, with a currently active for-sale inventory of 232 million square feet (MSF.) There were 7.9 MSF under construction, a 12-month Net Absorption of 3.8 MSF, and an 8% Vacancy Rate (down 0.2% in 2021.)
The average market rent rose 3.3% to $25.56/SF, the market sale price rose 7.3%, and the market Cap Rate fell 0.1% to 5.8%.
CRE Sales Statistics in 2022
Total sales volume increased to $7.1B. 835 properties were sold, an increase over last year, and time-to-sell fell to an average of 14.9 months. Average asking price rose to $336/SF, while the average sale-to-asking price dropped by 3.8%. Market sales price/SF began the year at $280, rose in the first half, to steady at about $292/SF
CRE Demand statistics in 2022
- 12-month net absorption of inventory increased by 1.6%. The 24-month lease renewal rate was 73.3%. The 12-month leased SF fell to 8.7 MSF. On average, it took 12.1 months to lease properties, which was quicker than in 2021, and the Months Vacant stat also fell to an average of 12.6.
- Market rent/SF began the year at $25, rising to $25.60 while asking rent rose from $30.00 to $30.50. Market rent growth YOY, went from 2% to 3.8%, ending the year at 3.2%.
- Occupancy at delivery began 2022 below the all-time average of about 57.2%, it rose to 80% and fell again, but it ended the year at just above 77%.
- Average Cap Rate was 5.8% in January, rising to 6.7%, then falling again to end at 5.8%. 38% of the Overall Cap Rate Distribution was in the 5-6% range, 18% in the 6-7% range, and 22% in the 7-8% range.
Northern Virginia’s Industrial Sector
General Stats
 General Stats
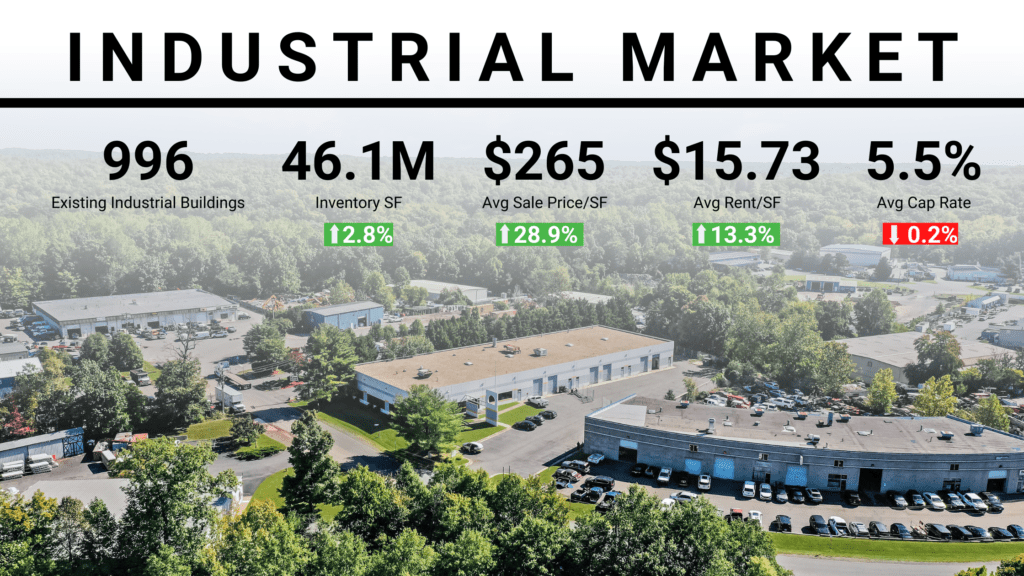
Existing industrial buildings increased to 996. The current active inventory stands at 46.1 MSF. 2.4 MSF are under construction, 12-month net absorption is 1.7 MSF (up 51.2%) and vacancy rate is down 1.1% standing at 1.5%.
Northern Virginia’s Industrial Sector Sales Statistics in 2022
Sales volume increased to $1.5B. 92 properties were sold, showing an increase over last year. Months-to-sell went down to an average of 7.2. The asking price rose to an average of $187/SF, the average sale-to-asking price showed a -7.8%% difference. Market sales price/SF sky-rocketed in 2021 to begin this year at $250, rising in Qs 1-3 to an average of $271/SF.
Industrial CRE Demand Statistics
- 12-month net absorption of inventory rose to 3.7%. The 24-month lease renewal rate averaged 83.4%. The 12-month leased SF fell to 2.2 MSF. The average time to lease properties fell to 2.8, and the months vacant also fell to 2.7.
- Market rent began 2022 at $14/SF and rose to $15.60 while asking rent rose from $12.00 to $13.80. Market rent growth YOY, continued its consistent rise in 2021, beginning 2022 at 12% and ending the year at 14%.
- Occupancy at Delivery started the year at 91%, rising in Q2 to 100%, then dropping to just below 83% in Q3.
- The average market Cap Rate was down 0.2% to an average of 5.5%. 48% of the overall Cap Rate Distribution was in the 5-6% range and 25% in the 6-7% range. 13% were in the 4-5% range, and the rest spread from 3% to above 10%.
Northern Virginia’s Multi-Family Sector
General Stats
 General Stats
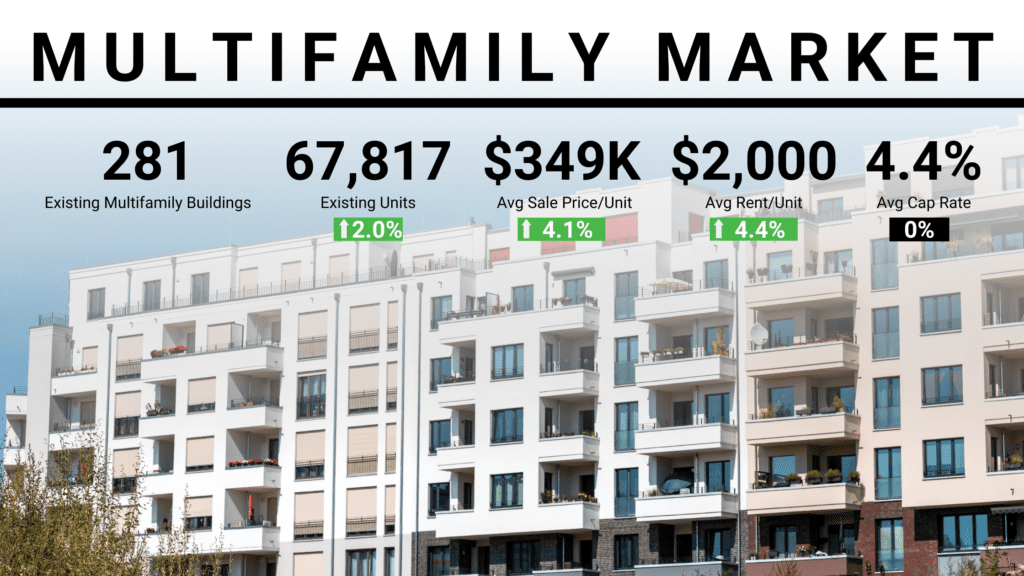
There are 67,817 inventory units (up 2%), 4,681 under construction (up 27.8%) with an average market rent per unit of $2000 (up 4.4% over 2021) a stable vacancy rate of 5.8%, a market sale price per unit averaging $349K (up 4.1%) and a market Cap Rate of 4.4%, just as it was last year.
Sales volume slipped to $1.6B. 23 properties were sold, also below last year’s figure. Months-to-sell was stable at 2.8. The asking price/unit averaged $303,915.
Availability and Asking Rents
There are 3,964 vacant units, an increase over last year. There are 281 existing buildings with an average unit/building of 241. 12. Asking rent/SF increased to $2.11, and the concession rate fell to 0.6%. Population in every potential renter group increased, other than the 30-39 age range which fell 10.7%.
Looking at asking rents/unit type, we see:
- Studio, $1733.
- 1Bedroom, $1803
- 2 Bedroom, $2,102.
- 3 Bedroom, $2358.
Asking rent/SF began 2022 at $2.02 and rose steadily to June, where it peaked at about $2.19, then fell to around 2.11 in November, the last month that figures are available.
Multi-family CRE Demand Statistics
- 12-month net absorption percent of inventory fell to 1.8%.
- Average market Cap Rate was 4.4%, as previously mentioned, but transaction Cap Rates began the year at below 4% and rose to end the year at 4.6%. 77% of the overall Cap Rate Distribution was in the 4-5% range with about 10% in either the 3-45 or 5-6%. The remaining stats were in the >8% range.
Northern Virginia’s Flex Sector Sales Statistics in 2022
General Stats
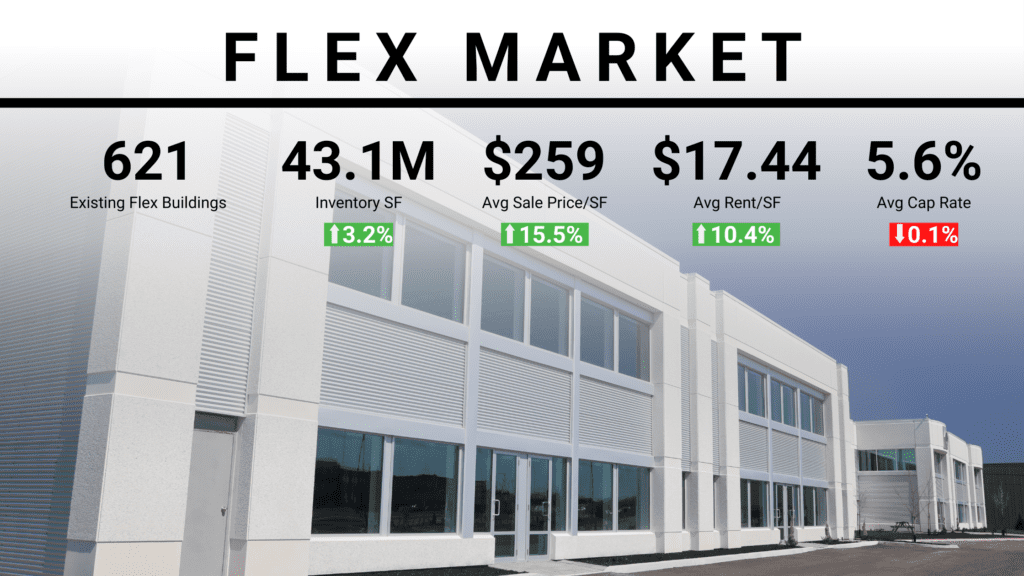 General Stats
The current inventory is 43.1 MSF with another 994 KSF under construction (down 42.5% on last year.) Sales volume slipped to $594 Million. 105 properties were sold (up on last year.) Time to sell fell to an average of 8 months. The asking price rose to $262/SF, and the average sale-to-asking price differed by -4.3%. Market sales price/SF began the year at around $248, and rose steadily to $260/SF.
Flex CRE Demand Statistics and Cap Rates
- 12-month net absorption of inventory fell to 4.2%. The 24-month lease renewal rate averaged 84.1%. The 12-month leased SF rose to 1.6 MSF. The average months to lease properties fell to 3.4, and the average months for a property to be vacant also fell to 3.5.
- Market rent/SF was $16/SF in Q1 and rose to $17.30 while asking rent rose from $14.80 to $16.00. Market rent growth YOY continued its rise from mid-2020 end Q3 at just over 10%.
- 12-month occupancy at delivery was down to 94.2% for the year.
- Market Cap Rate slipped from 0.1% to 5.6%. 70% of the overall Cap Rate Distribution was in the 5-6% range. The next largest group was 18% in the 6-7% range.
Northern Virginia’s Office Sector Sales Statistics in 2022
General Stats
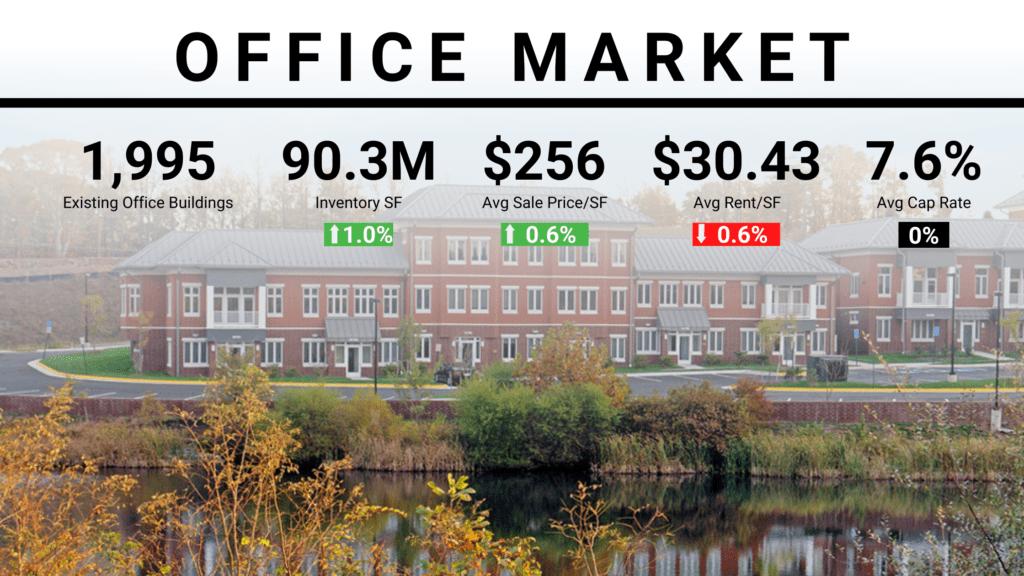 General Stats
Current inventory stands at 90.3 MSF (up 1%) plus 523 KSF currently under construction (down from 675 KSF in 2021.) Sales volume went down to $1.2B. 292 properties were sold, again, up in 2021. The months-to-sell number fell to an average of 8 months. The asking price rose to $262/SF, and the average sale-to-asking price differed by -4.3%. Market Sales Price/SF began the year at around $248 and rose steadily to $260/SF.
Office CRE Demand Statistics and Cap Rates
- 12-month net absorption rate as a percentage of inventory was -0.3%. The 24-month Lease Renewal Rate averaged 57.9%. The 12 Month Leased SF fell to 3.7 MSF. The average months to lease properties also went down and stood at 13.6. The average months for a property to be vacant also fell to 13.
- Market rent/SF has fallen since its peak in Q3 2019 and was 86.5% $30.50/SF in Q1, where it pretty much stayed.
- Occupancy rates began the year at a little over 85% and ended Q3 at around 84.3%.
- Market Cap Rate held steady at 7.6% compared to 2021, rising slightly in Q1 2022, to drop back in Q3. 70% of the Cap Rate Distribution was in the 7-8% range, 19% in the 8-9% range, and 7% in the 6-7% range.
Northern Virginia’s Retail Sector
General Stats
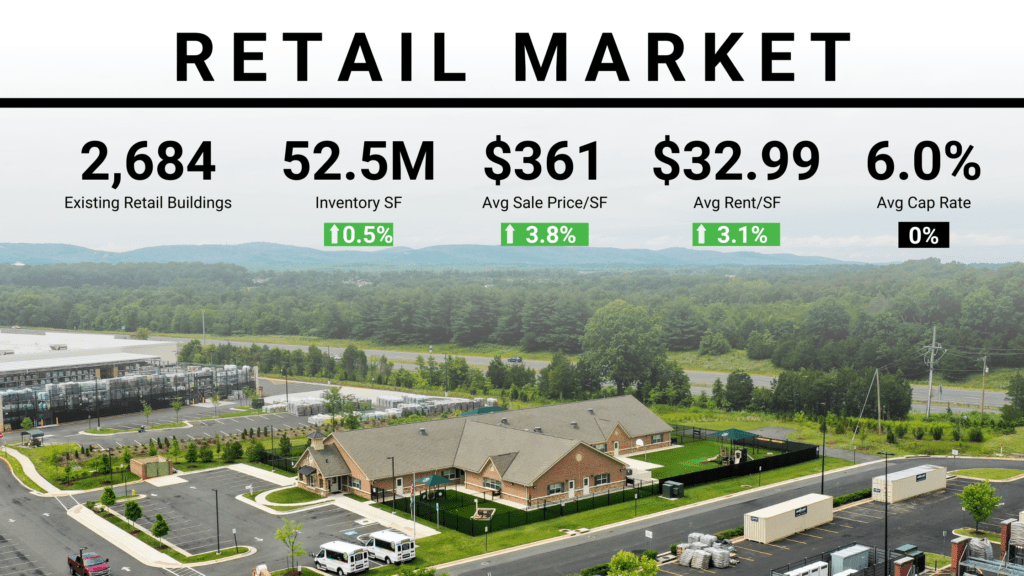 General Stats
Existing building numbers increased to 2,864. Current active inventory is 52.5 MSF (up 0.5%), 408 KSF are under construction (down 19.2%), 12-month net absorption is 493 KSF (up 58.1%) and vacancy rate is up 0.5% at 4.9%. The average market sales price is up 3.8% at $361/SF, and market rent/SF is up 3.1% at $32.99.
Northern Virginia’s Retail Sector Sales Statistics in 2022
Sales volume increased to $607M. 159 properties went under contract, down from last year. The time to sell went to 10.2 months. The asking price rose to $566/SF, and the average sale-to-asking price showed a difference of -8%. Market Sales Price/SF continued last year’s rise, to begin 2022 at $347.50, rising to $360/SF.
Retail CRE Demand Statistics
- 12-month net absorption averaged 0.9%. The 24-month lease renewal rate was 79.0%. The 12-month leased SF fell to 1.2. The average time to lease retail properties rose to 16.2, and the months vacant fell to 15.3.
- Market rent began the year at $32/SF, rising to $33 while asking rent/SF rose from $30 to a high of $31. Market rent growth YOY, continued its 2021 rise, beginning the year at 2% and to a high of 3.55% before beginning to dip in Q3.
- Occupancy rates started at 94.8%, rising quickly to 95.5%, then dropping back to 94.8%.
- Average market Cap Rate was stable at 6%. 60% of the overall Cap Rate distribution was in the 5-6% range, 26% in the 6-7% range, and 12% in the 4-5% range.
Northern Virginia’s Hospitality Sector
General Stats
There are 17,895 inventoried rooms (up 0.3%) with 733 under construction (up 35%.) The 12-month occupancy rate was 63.2% giving a 12-month RevPAR of $76. This stat shows an increase of 65% over 2021. The market sale price per room was down just 3.6% at $95.8K. The market Cap Rate stood at 8.8%, up 0.4% from last year.
Inventory and Sales Stats
There are 124 existing properties, with two new buildings being delivered this year resulting in 117 recently opened rooms, with 4 properties under construction. Sales volume fell to $90.7M on 10 sold properties, which had an average price of $13M and a market price per room of $95.8K as mentioned.
Performance Trends
- The overall occupancy rate was up at 71.3% with an annual daily rate of $137.06 and a trending daily RevPAR of $97.60. The 3-month occupancy rate rose to 70.7% resulting in an average, over that period, of $130.58 and a 3-month average RevPAR of $92.27.
- Monthly occupancy was higher every month this year, compared to 2021, as were the ADR and RevPAR.
Market Cap Rates
Cap Rates by class also rose every month this year. Luxury and Upscale ended Q3 at 8.45%, Midscale and Economy at 9.05%, and Upscale and Midscale at 9.1%. Overall, the market Cap Rate is forecast to continue its rise until the end of the year, then level out.
And Finally
Serafin Real Estate specializes in the northern Virginia CRE market. This report is an overview of primary stats. If you would like to do a deep dive into inventory, sales, or other stats, then please feel free to contact us to set up a time to discuss these issues. If you would like us to either list and market your property or want to find an ideal property to buy, then, again, just click here.
Resources and Disclosure: Information and data collected from CoStar, LoopNet, and other proprietary sources of Serafin Real Estate Inc