
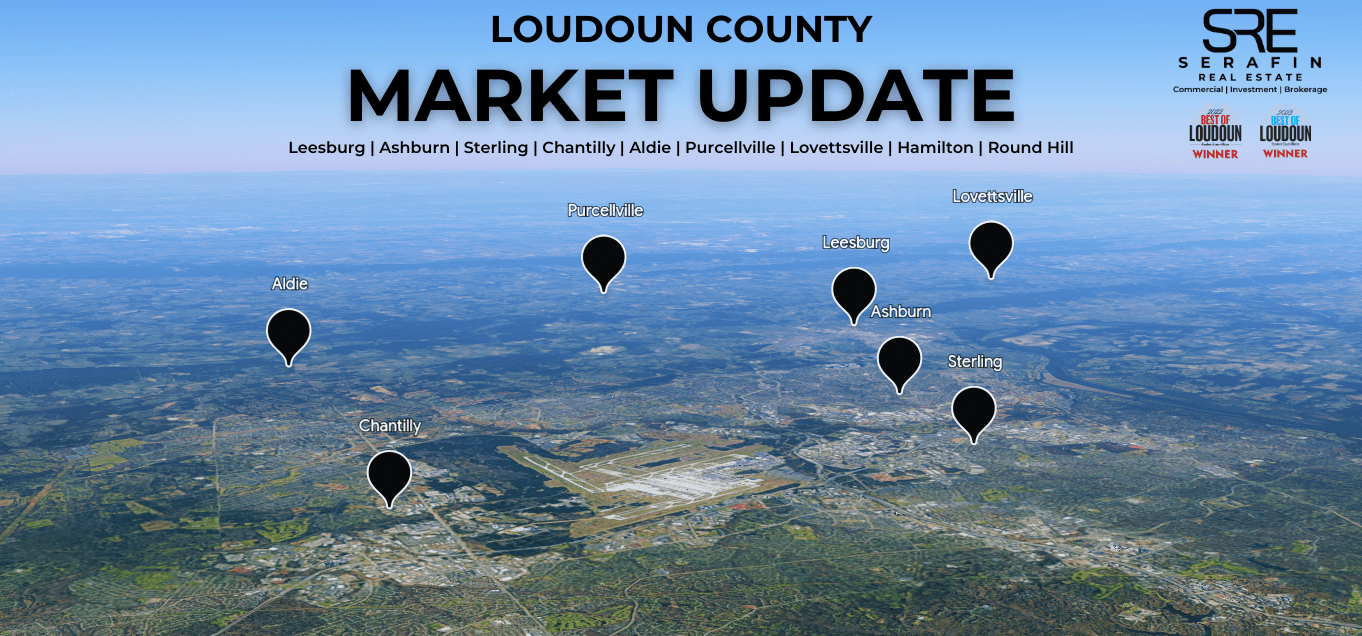
CRE Market Update for Loudoun County Plus Nine Towns and Cities
Serafin Real Estate’s CRE market update for these communities will give you a breakdown of the current CRE market statistics for Loudoun County as a whole. We will also cover CRE market stats for nine cities within the County: Leesburg, Ashburn, Sterling, Chantilly, Aldie, Purcellville, Hamilton, Round Hill, and Lovettsville. We will compare 2023 YTD to 2022’s Q3 and 4. Our goal is to give you a 12-month CRE market update for cities in Loudoun County.
Loudoun County Business Background
In a previous article, we gave you a 2020-2023 (YTD) analysis for Northern Virginia, which included a specific section on Loudoun County.
For our readers who are new to this area, as well as getting specific CRE stats, you may like to know that Loudoun County’s Department of Business Development has a dedicated team to assist new and established business development. The Department includes a Fast-Track Commercial Investment Program. as well as a C-PACE Program to provide savings for local businesses that plan to revitalize and improve property values.
While Loudoun County is home to many major corporations, there are also more than 7,300 businesses with less than 20 employees who not only want to grow their market footprint but who, in many cases, lease business premises from passive investors.
Loudoun County CRE Statistical Overview
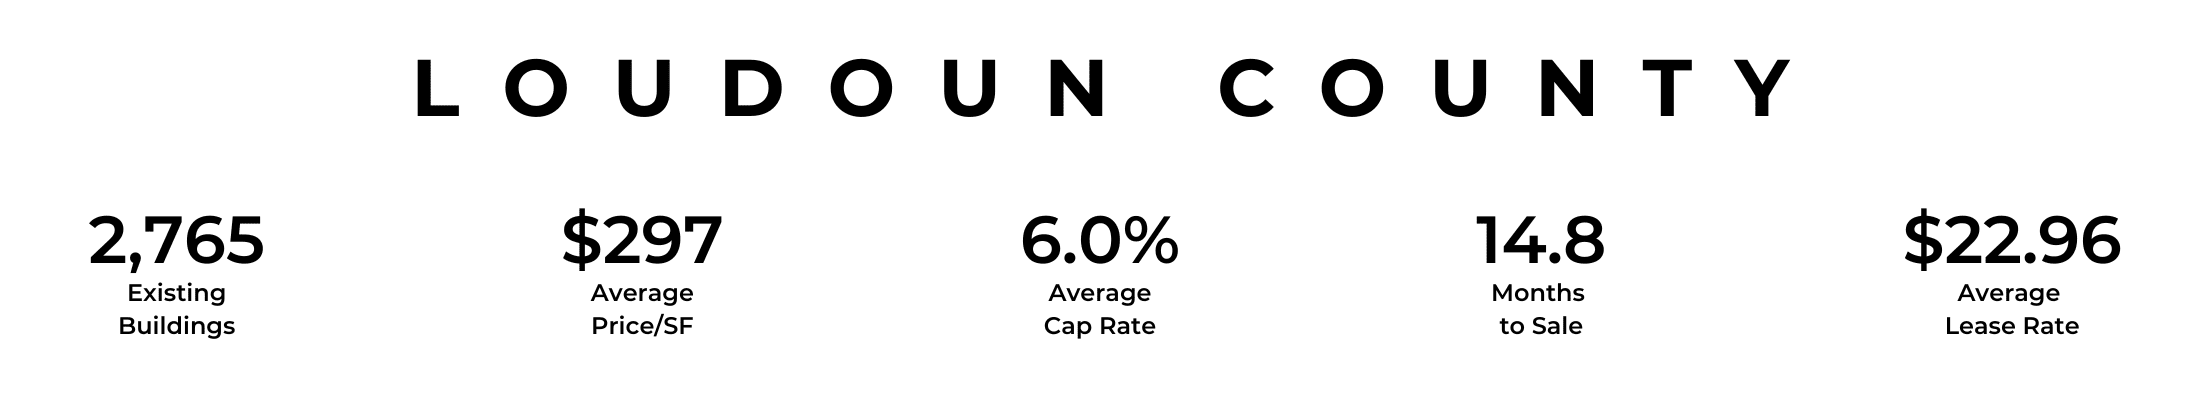
There are 2,765 existing commercial properties in Loudoun County. Of those:
- 22.1% are Office Buildings
- 14.7% are Industrial
- 39.3% are Retail
- 10.1% are Flex Buildings
- 2.7% are Multifamily
- 11.1% are Specialty Properties, such as schools, child care, health care, and hospitality.
Loudoun County CRE Statistical Breakdown
- There is, currently, an inventory of 87.3 million square feet (MSF). An increase of 2.2% over last year.
- 272 properties were sold in the past 12 months totaling $1.5 Billion.
- Market Sale Price/SF (MSP/SF) averaged $297 (up 7.8%) with a Sale to Asking Price diff of -9%.
- Asking Prices averaged $322/SF in Q3 2022 and after a slight dip, rose to $330/SF in Q2 2023.
- MSP/SF (covering a 10-year period) ranged from <$80 to >$640. 27% of sales (rounded to the nearest %) were in the $160 – $240/SF. 26% in the $240 – $320/SF, and 18% in the $320 – $400/SF.
- 8MSFs are currently under construction. An increase of 58.2% over last year.
- 12-month net absorption is 2.2MSF (down 8.1% from last year.)
- Occupancy rate stands at 96.1% (a change of +0.5%.)
- 12-month leased occupancy at delivery was 3.2MSF.
- The 24-month lease renewal rate was 82.7%.
- Market Cap Rate averaged 6.0%. In Q3 2022 it was 5.9%, and in 2023 Q2 it stood at 5.8%.
- Market Rent/SF increased from an average of $22.25 (2022 Q3) to $23.00 (Q2 2023.)
- The 50% leasing probability threshold is 7.2 months.
Leesburg CRE Statistical Breakdown
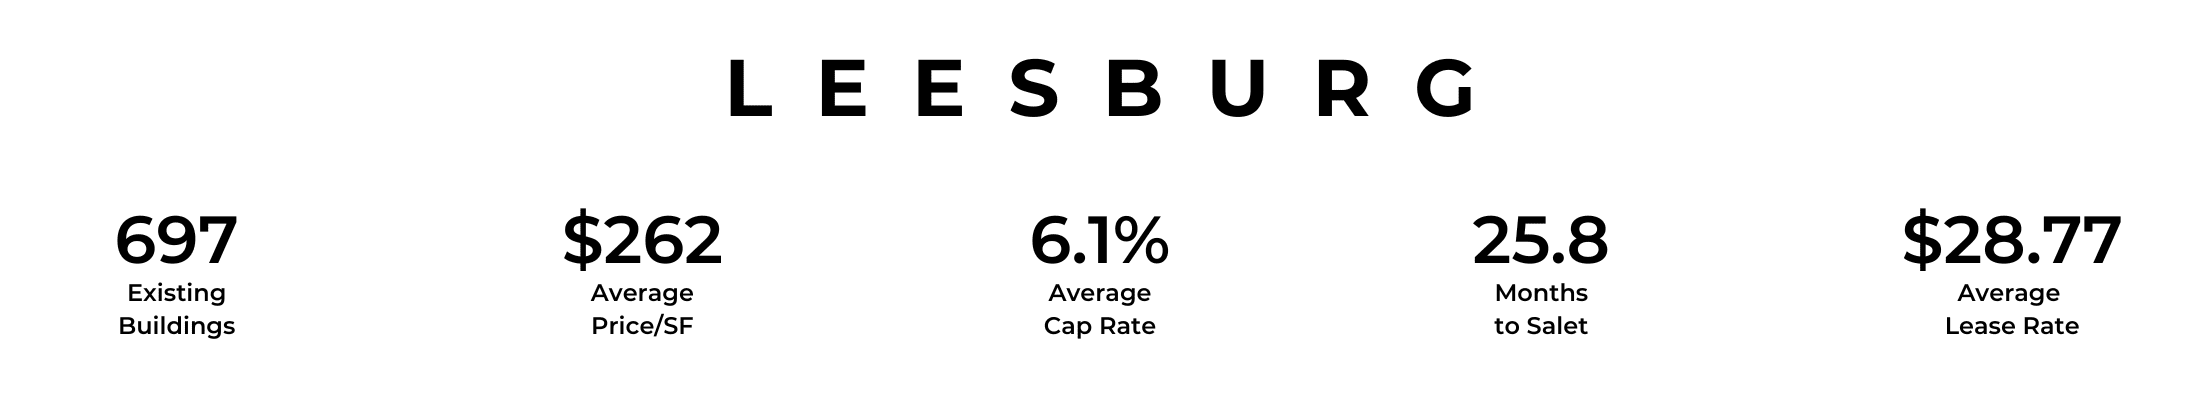
Leesburg is Loudoun’s county seat and is home to tech, finance, and retail companies as well as having its own executive airport.
- Current inventory is 10.1 MSF. An increase of 1.2%.
- 42 properties were sold in the past 12 months totaling $149 Million.
- Market Sale Price/SF (MSP/SF) averaged $262 (down 3.2%) and a Sale to Asking Price diff of -9.1%.
- Asking Prices averaged $200/SF in Q3 2022, falling to $193 in Q4, and rising again to $333/SF by Q2 2023.
- MSP/SF ranged from <$90 to >$720. 37% of sales were in the $180 – $270/SF. 17% in the $270 – $360/SF range, and 19% in the $360 – $450/SF range.
- 141KSF are under construction down 7.7% from 2022.
- 12-month net absorption is 195KSF, down 66.5% from last year.
- Occupancy rate stands at 96.2%.
- 12-month leased occupancy at delivery was 212KSF.
- The 24-month lease renewal rate was 84.1%.
- Market Cap Rate in Q3 2022 was 5.8%, and in 2023 Q2 it is projected to be 6.2%.
- Market Rent/SF increased from an average of $28.20 (2022 Q3) to $28.80 (Q2 2023.)
- The 50% leasing probability threshold is 8.3 months.
Ashburn CRE Statistical Breakdown
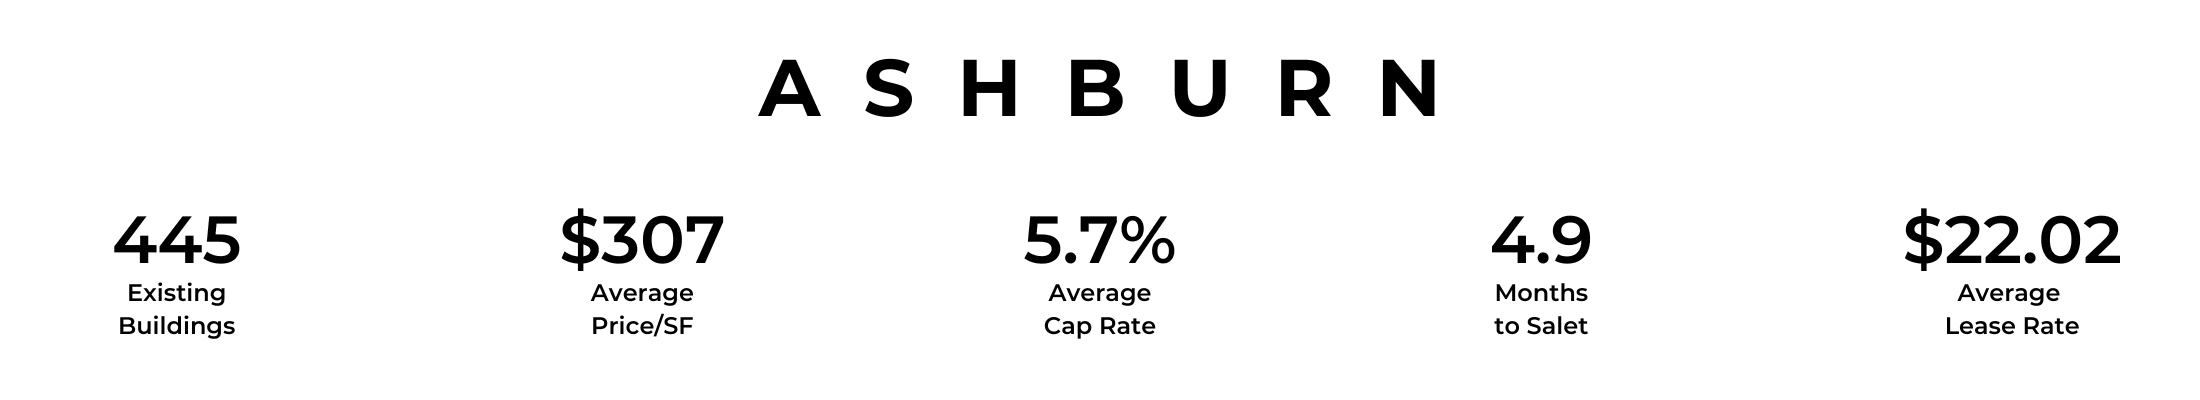
Ashburn is North America’s major data center market; it is integral to the Dulles Tech Corridor and is known locally as Data Center Alley.
- Current inventory is 25.4 MSF; an increase over last year of 1.4%.
- 42 properties were sold for $552 Million.
- MSP/SF averaged $307 (+9% over 2022) with a Sale to Asking Price diff of -6.2%.
- Asking Prices averaged $450/SF in Q3 2022, then fell to approximately $340/SF in Q4, and rose again to $450/SF by Q2 2023.
- MSP/SF ranged from <$70 to >$560. 22% of sales were in the $210 – $280/SF. 20% in the $280 – $350/SF range, 17% sold above $560/SF and approximately 14% were in the $350 – $420/SF range.
- 3MSF is under construction, up 224% compared to 2022.
- 12-month net absorption is 255KSF; down 52.9%.
- Occupancy rate stands at 96.9%.
- 12-month leased occupancy at delivery was 794KSF.
- The 24-month lease renewal rate was 87%.
- Market Cap Rate averaged 5.7%. In Q3 2022 it was 5.75%, it rose a little for Q4, and in 2023 Q2 it is back at 5.75%.
- Market Rent/SF increased from an average of $21.60 (2022 Q3) to $22.00 (Q2 2023.)
- The 50% leasing probability threshold is 7 months.
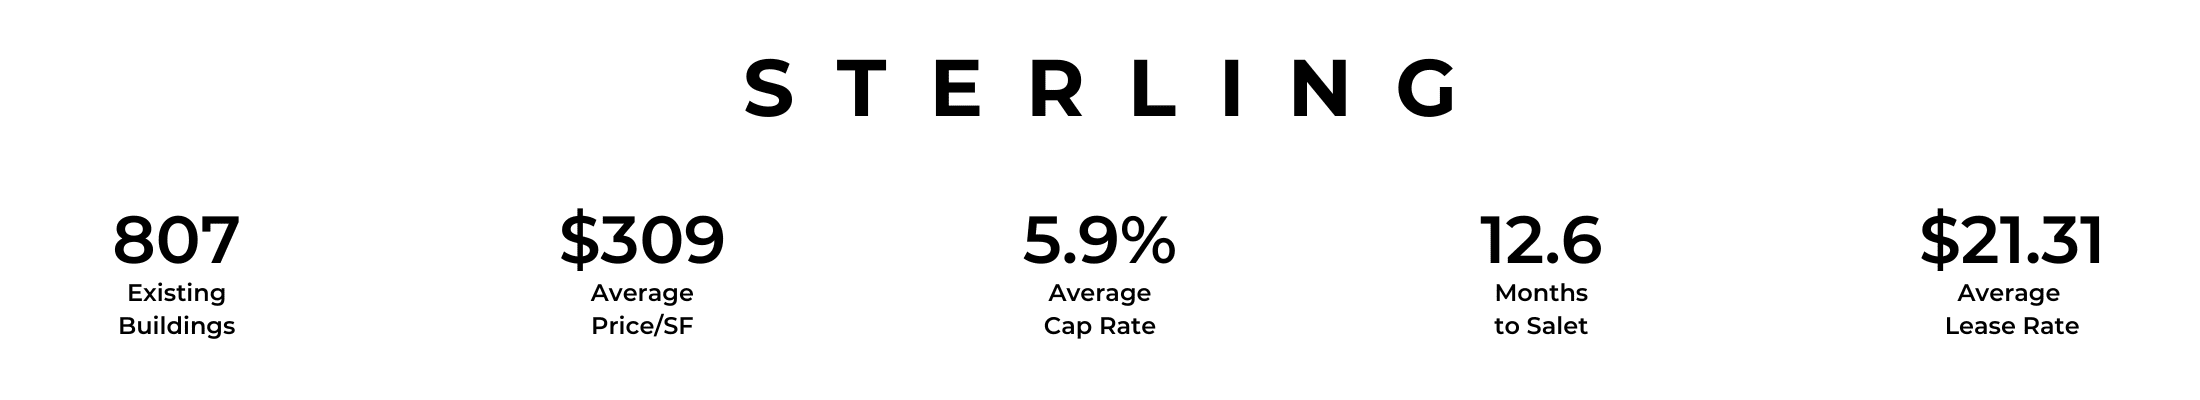
Sterling CRE Statistical Breakdown
Sterling is well known for its high-tech business centers, high-quality residential communities, and its industrial and flex spaces.
- Current inventory stands at 33.1 MSF; an increase over 2022 of 4.1%.
- 111 properties were sold for $488 Million.
- MSP/SF averaged $309 (+11.1% over 2022) with a Sale to Asking Price diff of -3.6%.
- Asking Prices peaked at an average of $332/SF in Q3 2022, then fell to $280/SF in Q2 2023.
- MSP/SF ranged from <80 to >$640. 28% of sales were in the $240 – $320/SF range, 27% in the $160 – $240/SF range, 15% were in the $320 – $400/SF range, and 12% sold above $640/SF.
- 756KSF are under construction, down 54.1% compared to last year.
- 12-month net absorption is 1.4MSF; an increase of 170.9%.
- Occupancy rate stands at 96.8%.
- 12-month leased occupancy at delivery was 1.4MSF.
- The 24-month lease renewal rate was 81.6%.
- Market Cap Rate in Q3 2022 was 5.9%, rising to 6.2% in Q4, and falling in 2023 Q2 to 5.9%.
- Market Rent/SF increased from an average of $20.40 at the start of 2022 Q3 to $21.40 in Q2 2023.
- The 50% leasing probability threshold is 6.8 months.
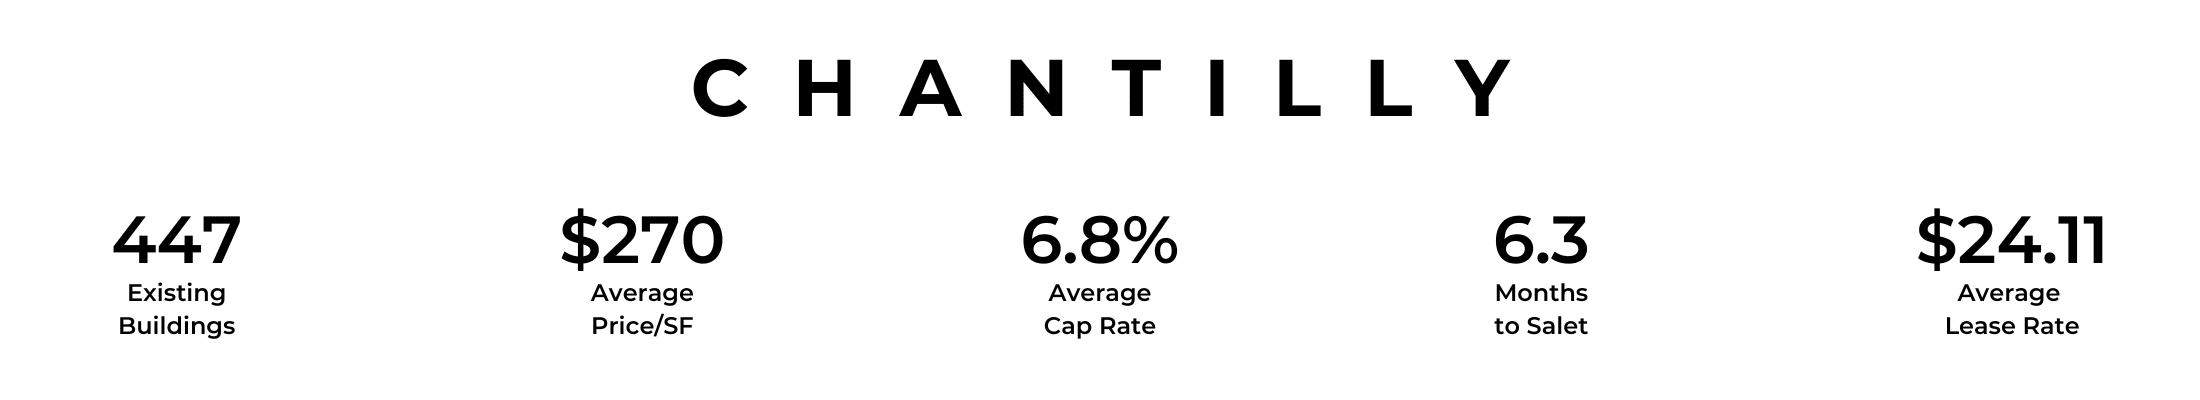
Chantilly (Loudoun County) CRE Statistical Breakdown
Chantilly is at the intersection of major highways, giving easy access to the Dulles/Reston/Tysons Corner technology corridor as well as other major employment centers.
- Current inventory stands at 22.1 MSF; an increase of 0.4% over 2022.
- 57 properties were sold for $297 Million.
- MSP/SF averaged $270 (+4.7% over 2022) with a Sale to Asking Price diff of -1.3%.
- Asking Prices stood at $320/SF in Q3 2022, rose a little in Q4, then fell to $270/SF in Q2 2023.
- MSP/SF ranged from $70 to >$560. 29% of sales were in the $210 – $280/SF range, 27% in the $210 – $280/SF range, 13% were in the $280 – $350/SF range, and 11% sold above $560/SF.
- 3MSF is under construction, an increase of 254.3% over last year.
- 12-month net absorption is 303KSF; a reduction of 32.7%.
- Occupancy rate stands at 91.4%.
- 12-month leased occupancy at delivery was 1MSF.
- The 24-month lease renewal rate was 74.8%.
- Market Cap Rate at the start of Q3 2022 was 6.8% and was also at 6.8% in Q2 2023.
- Market Rent/SF increased from an average of $23.60 at the start of 2022 Q3 to just about $24.10 in Q2 2023.
- The 50% leasing probability threshold is 7.4 months.
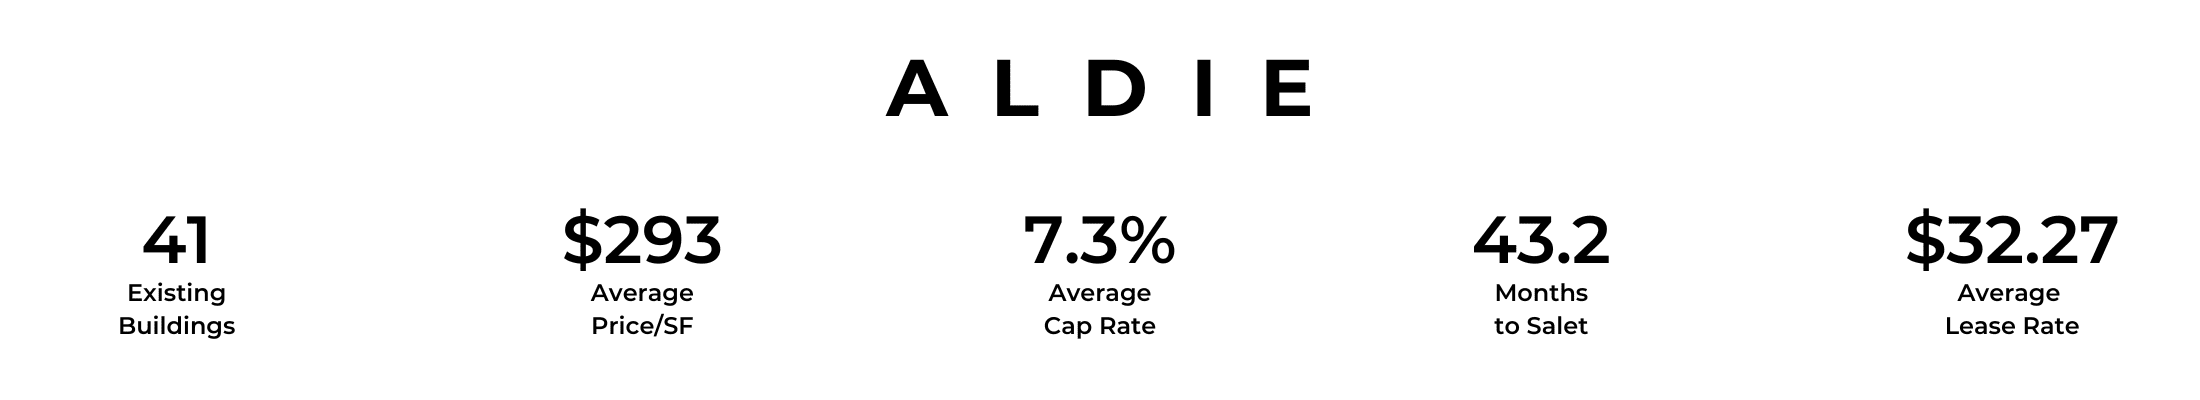
Aldie CRE Statistical Breakdown
Aldie is an unincorporated community and is located between Chantilly (South Riding) and Middleburg.
- Current inventory stands at 470KSF.
- 6 properties were sold for $64.9 Million.
- MSP/SF averaged $293 (-1.1% compared to last year) with a Sale to Asking Price diff of -12.4%.
- MSP/SF ranged from $80 to >$640. Just under 41% of sales were in the $240 – $320/SF range, 19% in the $160 – $240/SF range, 16% were in the $320 – $400/SF range, another 9% in the $480 – $560 range, and approximately 6% sold above $640/SF.
- 12-month net absorption is 8.7KSF; a reduction of 12.8%.
- Occupancy rate stands at 95.6%.
- The 24-month lease renewal rate was 80%.
- Market Cap Rate at the start of Q3 2022 was 7.3%, and rising to 7.5% in Q2 2023.
- Market Rent/SF averaged $32.27. It stood at $31.80 at the start of 2022 Q3 and rose to $32.40 in Q2 2023.
- The 50% leasing probability threshold is 12 months.
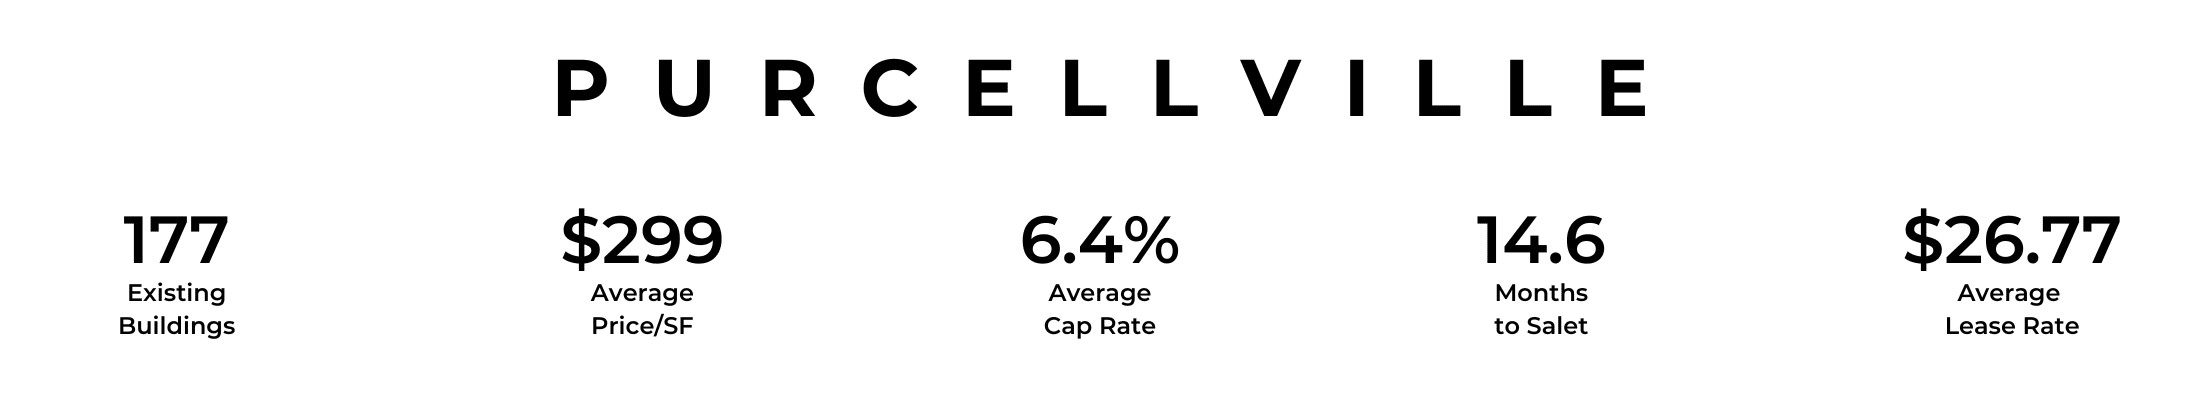
Purcellville CRE Statistical Breakdown
Purcellville is considered the economic hub of western Loudoun County with more than 800 active businesses.
- The current inventory is 1.5 MSF; an increase over 2022 of 0.7%.
- 15 properties were sold for $31.4 Million.
- MSP/SF averaged $299 (-2.0%) with a Sale to Asking Price diff of -6.5%.
- Asking Prices averaged $225/SF beginning Q3 2022 at $500/SF, rising to $580/SF in Q4, and ending Q2 2023 at $430/SF.
- MSP/SF ranged from <$60 to >$480. 22% of sales were in the $180 – $240/SF range, 21% in the $240 – $300/SF range, 19% were in the $300 – $360/SF range, and 17% of sales were above $480/SF.
- 7KSF is under construction, down 30% from last year.
- 12-month net absorption is 69.4KSF; a huge increase of 614.7% compared to the previous year.
- Occupancy rate stands at 97.9%.
- 12-month leased occupancy at delivery was 34.6KSF.
- The 24-month lease renewal rate was 77.9%.
- Market Cap Rate averaged 6.4%. In Q3 2022 it was 6.1%, rising to 6.4% in Q2 2023.
- Market Rent/SF averaged $26.77. It began Q3 2022 at $26.00/SF and began at $26.25 in Q2 2023.
- The 50% leasing probability threshold is 13.8 months.
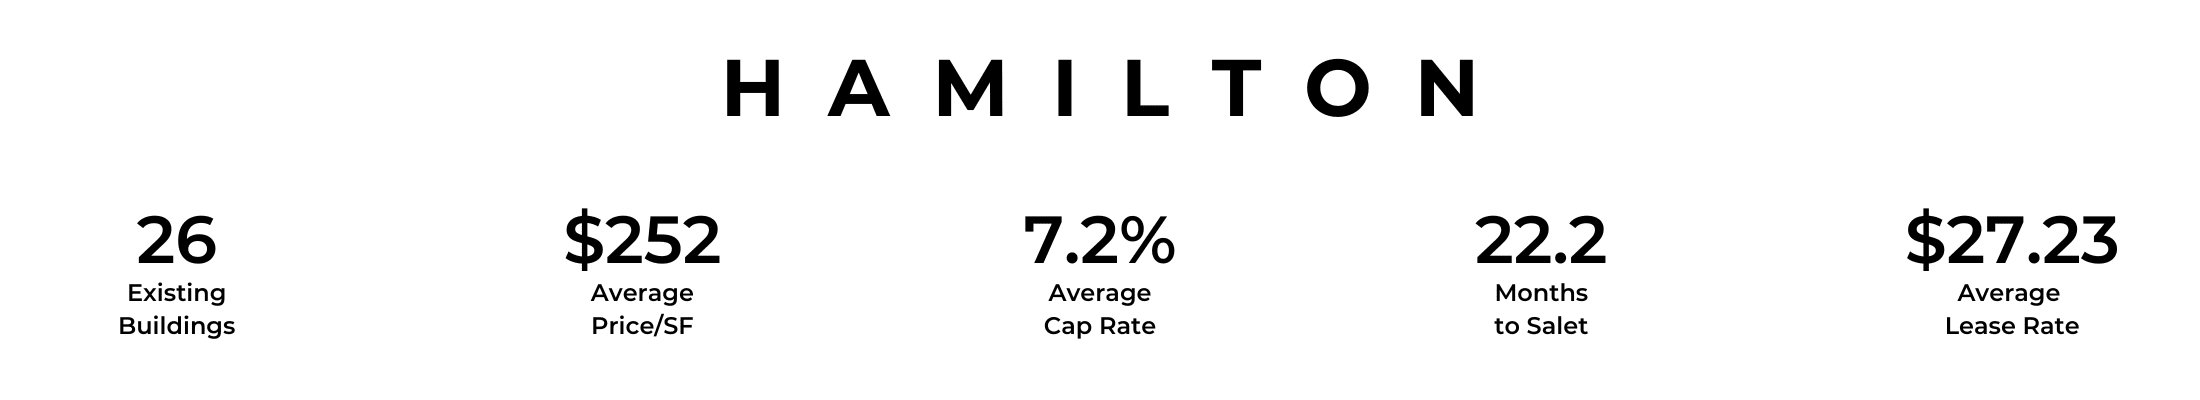
Hamilton CRE Statistical Breakdown
Hamilton is a small town in Loudoun between Leesburg and Purcellville. Its primary businesses are professional, scientific, and technical services.
- The current inventory is 93.6KSF. No change in the past year.
- No properties were sold in the previous 12 months.
- MSP/SF averaged $252.
- No properties are under construction.
- The 24-month lease renewal rate was 100%.
- Market Cap Rate averaged 7.2%. In Q3 2022 it was 6.9%, rising to 7.15% in Q2 2023.
- Market Rent/SF averaged $27.23 It began Q3 2022 at $26.60/SF and rose to $27.20 in Q2 2023.
- The 50% leasing probability threshold is 6 months.
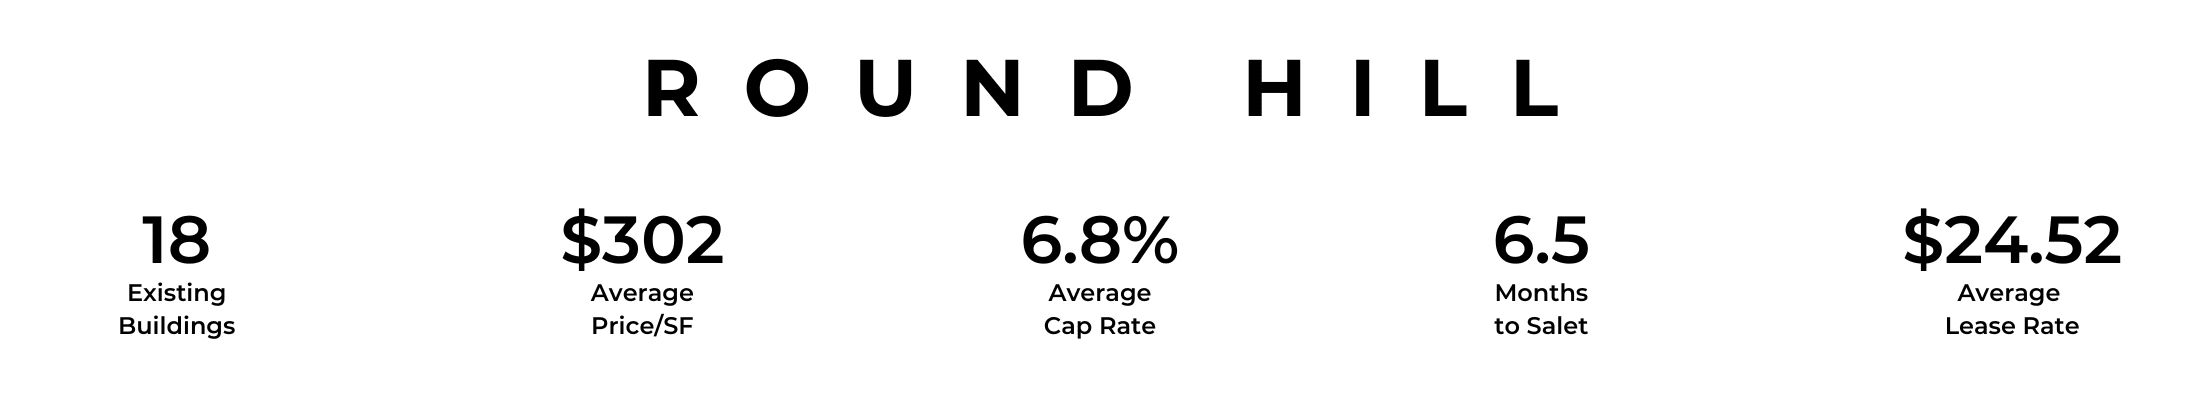
Round Hill CRE Statistical Breakdown
Round Hill is a rural community set in the foothills of the Blue Ridge Mountains, and about 50 miles NW of Washington DC.
- Current inventory is 54.7KSF.
- 2 properties were sold in the past 12 months totaling $3.3 Million.
- MSP/SF averaged $302 (up 2.6%) and a Sale to Asking Price diff of -24.6%.
- Asking Prices averaged $325/SF in Q3 2022. No other details are available for later in the period we are analyzing.
- No properties are under construction.
- Occupancy rate stands at 100% and has done so since 2019.
- The 24-month lease renewal rate was 100%.
- The average Market Cap Rate stood at 6.8% (up 0.3%). Market Cap Rate in Q3 2022 was 6.6%, and in 2023 Q2 it is 6.8%.
- Market Rent/SF averaged $24.52 (an increase of 2.6%) increased from $24.00 in Q3 2022 to $24.60 in Q2 2023.
- The 50% leasing probability threshold is 7.5 months.
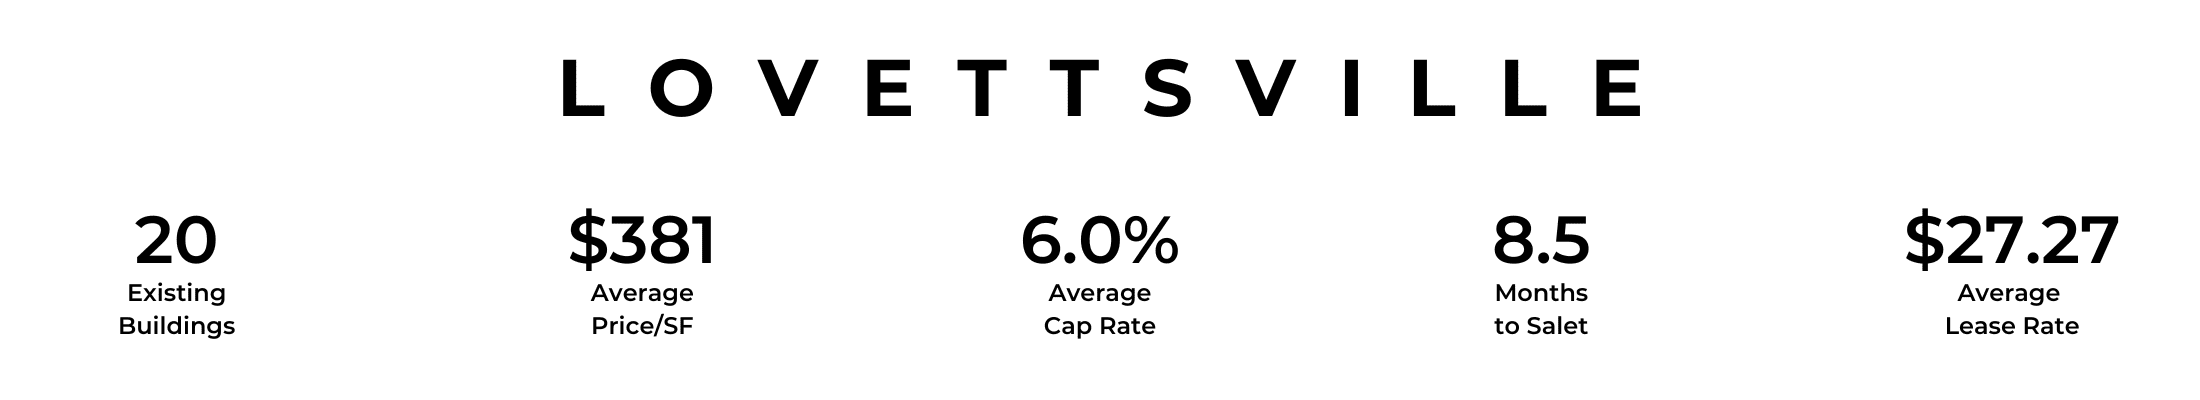
Lovettsville CRE Statistical Breakdown
Lovettsville is a small town at the northern tip of the Commonwealth.
- Current inventory is 74KSF. An increase of 40.6%.
- No properties were sold in the past 12 months.
- MSP/SF was calculated at $380 in Q3 2022 and hovered at around that number for the next year.
- 14KSF is under construction.
- 12-month net absorption rate as a percentage of inventory calculates out at 10.3%.
- Occupancy rate stands at 81.4%.
- 12-month occupancy at delivery was 18.5%.
- The 24-month lease renewal rate was 80.9%.
- Market Cap Rate averaged 6.0%.
- Market Rent/SF increased from an average of $26.60 in 2022 Q3 to $27.40 in Q2 2023.
Serafin Real Estate
We are a leading commercial real estate brokerage in Northern Virginia. Our purpose is to enable our clients to deliver on their own goals. We do this because we are experts in our market, we focus totally on understanding and then meeting our clients’ needs, and we employ the most up-to-date technology. It enables us to maximize the results our seller clients set as their goals. We specialize in two ways that integrate collectively, 1.) geographically in Loudoun County, western Fairfax County, and northern Prince William County, and 2.) property type including early education centers, specialty properties including breweries, wineries, and event centers, industrial, and flex properties.
You can learn more about our brokerage, processes, and current listings by clicking here: Serafin Real Estate.
One of the primary reasons our clients succeed is that they choose us as their principal broker. You can learn more about choosing the right broker by reading this article. And, to discuss your specific needs, or simply to learn more, you are more than welcome to contact us.
* Data researched and collected via Costar (www.costar.com) and internal information of Serafin Real Estate.