
Washington DC Area and Northern Virginia CRE by the Numbers
Investors, owners, and user operators need to know the numbers that make up the commercial real estate market profile for Northern Virginia and the DC Area.
Whether you are looking to invest, sell, or lease CRE property in Northern Virginia, the more you know about the basic details, the clearer you are, and the more focused your decisions will be.
In this month’s article, we will show you what you can expect in the DC Area, Loudoun, Fairfax, and Prince William Counties. Our focus is on:
- Average Days on Market from Listing to Closing in each area.
- Average Price Sold per Square Foot.
- The number of properties sold, dollar volumes, and percentage of properties sold compared to the total number of existing commercial real estate properties.
We, at Serafin Real Estate, also want to reinforce – based on hard numbers – the results we achieve for our clients.
Many of our buyer-clients are passive investors as well as owner-operators. Our seller clients, like all owners, want to get the highest price the market will allow, to sell in their preferred timescale, and to settle on the best terms. While we will not dive into our marketing, property search, and negotiating strategies here, we trust the numbers will speak for themselves and will encourage you to contact us to discuss your goals in more detail.
Washington DC Area CRE Statistics 2020 – 2022 and 2023 YTD
Here you see the average days on market (DOM), total properties sold, the average $/SF achieved in each year, and, finally, the sold volume as a percentage of total existing commercial properties.
2020:
- 471 average days on market from listing to close
- $214/sf average price per square foot for sold properties
- $20B of volume sold
- 2,626 properties sold, which is 4.3% of the total properties
2021:
- 483 average days on market from listing to close
- $244/sf average price per square foot for sold properties
- $30.4B of volume sold
- 3,789 properties sold, which is 6.2% of the total properties
2022:
- 420 average days on market from listing to close
- $267/sf average price per square foot for sold properties
- $28B of volume sold
- 3,558 properties sold, which is 5.8% of the total properties
2023:
- $265/sf average price per square foot for sold properties
- $1.5B of volume sold
- 308 properties sold as of March 10, 2023
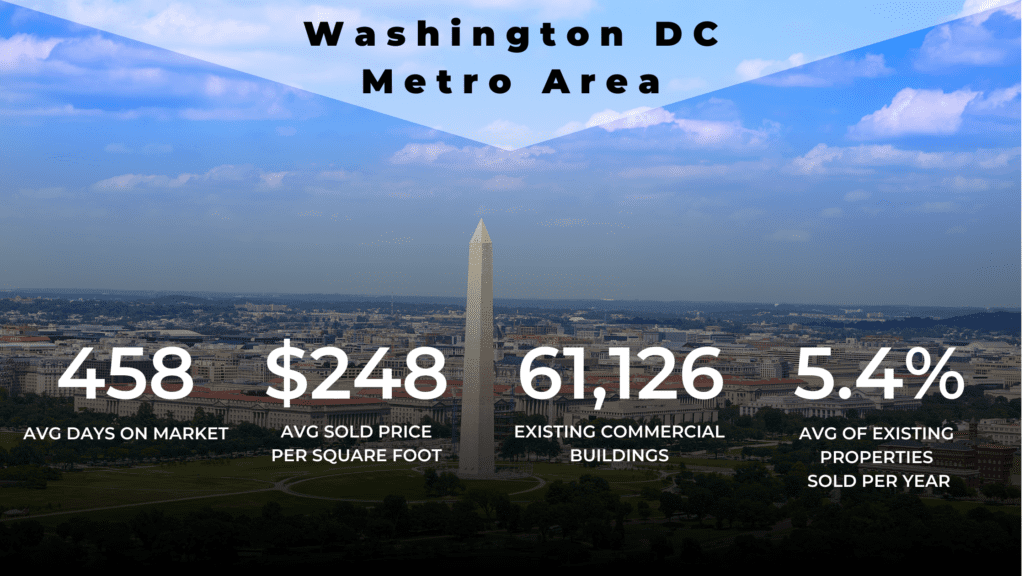
Washington DC Area Summary
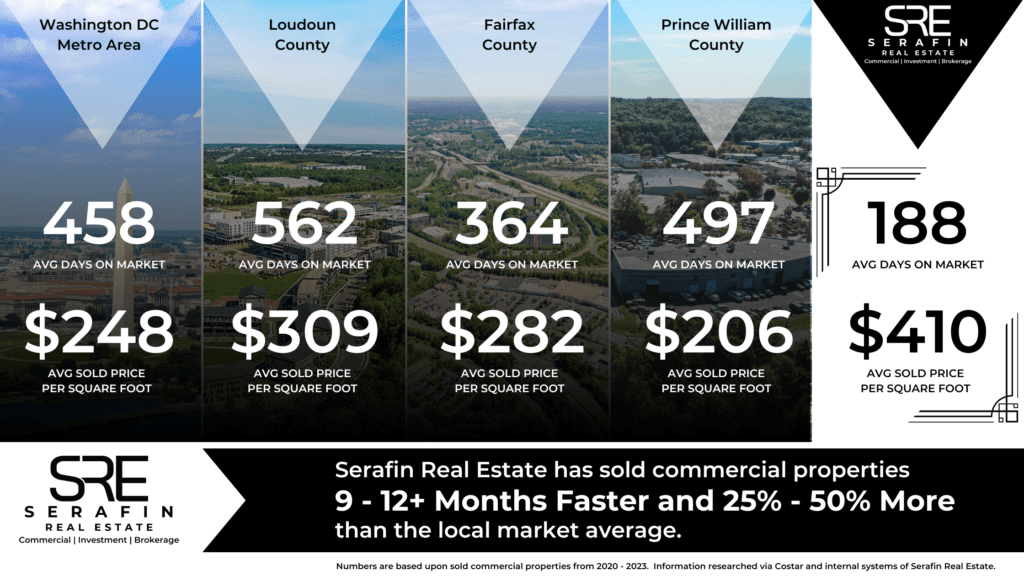
On average for the three years, Sellers could expect to wait 458 days (or a year and three months) from listing their property to closing. An average of 5.4% of the 61,126 existing commercial buildings in Washington DC Metro Area trade per year.
Loudoun County CRE Statistics 2020 – 2022 and 2023 YTD
We will use the same breakdown for each of the three counties as we did for the DC Area and will finish with a direct comparison to Serafin’s results.
2020:
- 552 average days on market from listing to close
- $213/sf average price per square foot for sold properties
- $1.4B of volume sold
- 157 properties sold, which is 5.8% of the total properties
2021:
- 600 average days on market from listing to close
- $249/sf average price per square foot for sold properties
- $2.8B of volume sold
- 289 properties sold, which is 10.6% of the total properties
2022:
- 534 average days on market from listing to close
- $369/sf average price per square foot for sold properties
- $2.5B of volume sold
- 237 properties sold, which is 8.7% of the total properties
2023:
- $405/sf average price per square foot for sold properties
- $363M of volume sold
- 21 properties sold as of March 10, 2023
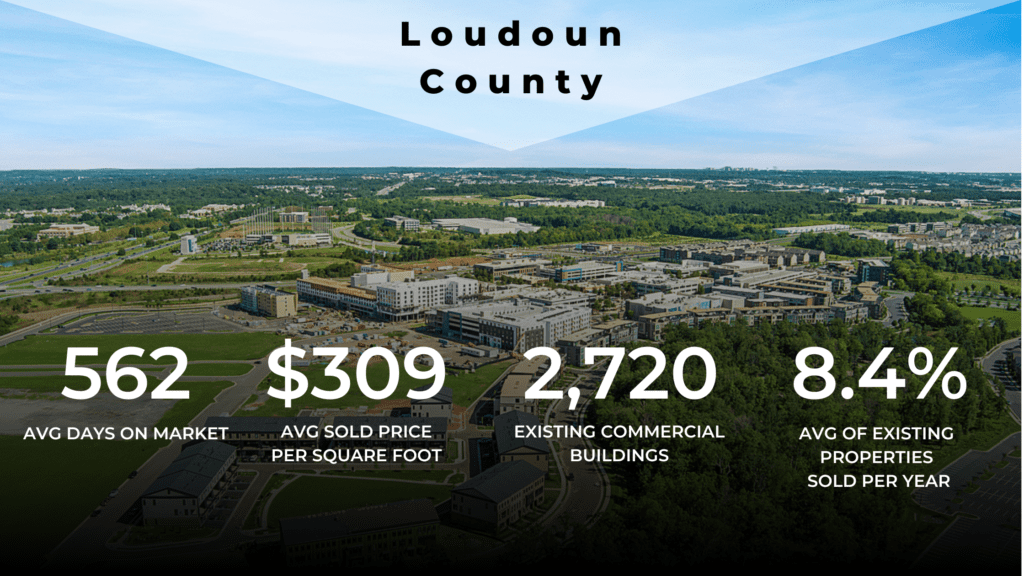
Loudoun County Summary
In the three years, Sellers waited on average 562 days (a year and six months) from listing to closing. An average of 8.4% of the existing commercial buildings in Loudoun County trade per year.
Fairfax County: 2020 – 2022 and 2023 YTD
2020:
- 453 average days on market from listing to close
- $271/sf average price per square foot for sold properties
- $3.9B of volume sold
- 309 properties sold, which is 4.8% of the total properties
2021:
- 321 average days on market from listing to close
- $240/sf average price per square foot for sold properties
- $4.8B of volume sold
- 321 properties sold, which is 7.0% of the total properties
2022:
- 318 average days on market from listing to close
- $369/sf average price per square foot for sold properties
- $5.3B of volume sold
- 468 properties sold, which is 7.3% of the total properties
2023:
- $369/sf average price per square foot for sold properties
- $144M of volume sold
- 23 properties sold as of March 10, 2023
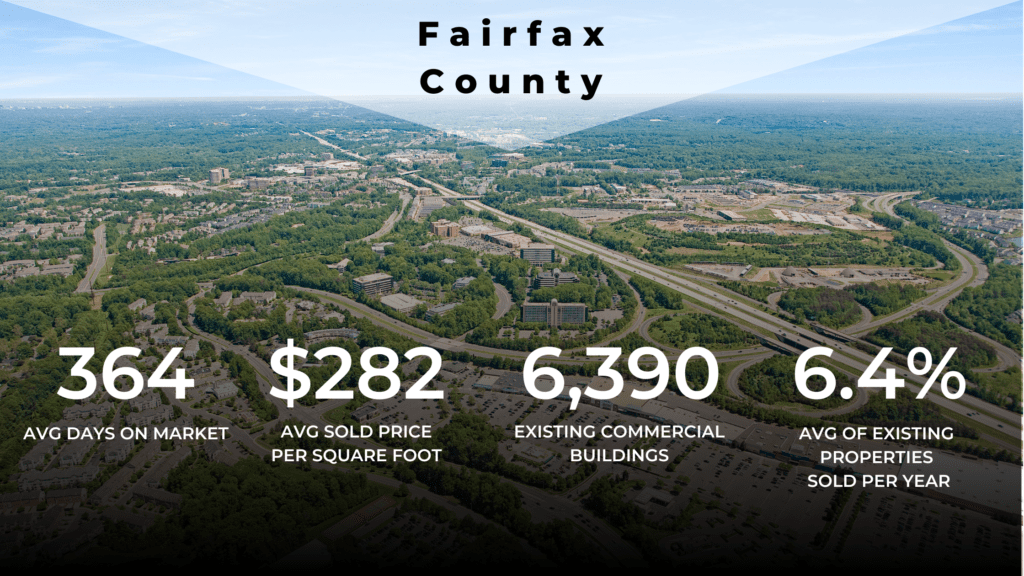
Fairfax County Summary
Overall, Sellers waited an average of 364 days from listing to closing. An average of 6.4% of the existing commercial buildings in Fairfax County trade per year.
Prince William County: 2020 – 2022 and 2023 YTD
2020:
- 531 average days on market from listing to close
- $178/sf average price per square foot for sold properties
- $1.3B of volume sold
- 186 properties sold, which is 5.5% of the total properties
2021:
- 498 average days on market from listing to close
- $215/sf average price per square foot for sold properties
- $2B of volume sold
- 275 properties sold, which is 8.1% of the total properties
2022:
- 256 average days on market from listing to close
- $247/sf average price per square foot for sold properties
- $2B of volume sold
- 227 properties sold, which is 6.7% of the total properties
2023:
- $185/sf average price per square foot for sold properties
- $107M of volume sold
- 30 properties sold as of March 10, 2023
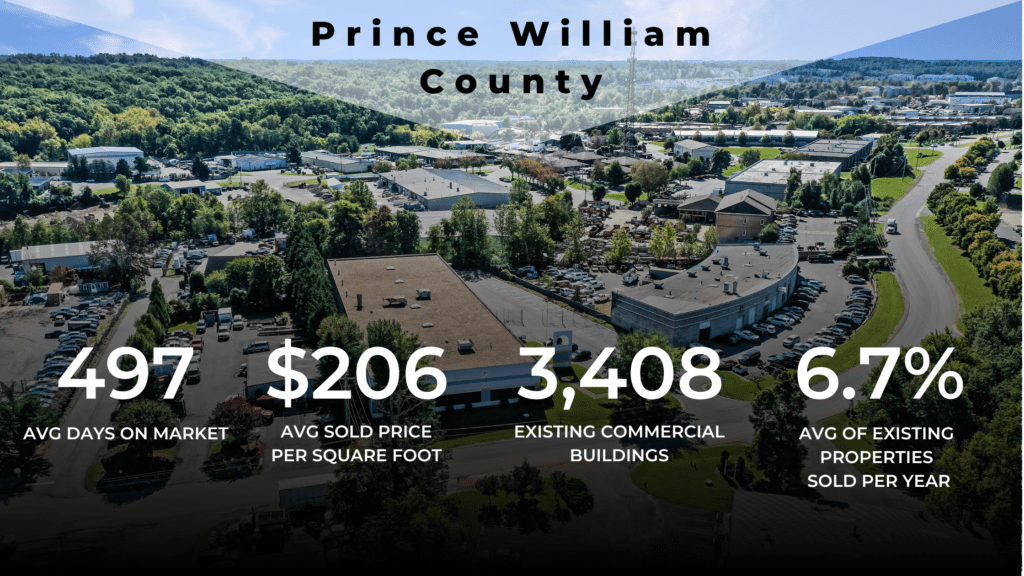
Prince William County Summary
On average, it took Sellers 497 days (just over one year and four months) from listing to closing. An average of 6.7% of the existing commercial buildings in Prince William County trade per year.
The Takeaway
All commercial real estate specialists work hard to achieve the right results for their clients whether selling or buying. Serafin Real Estate is a close-knit team of precise specialists. We have applied our expertise to develop strategies which harness our individual skills and experience and have a world-wide platform for maximizing the result we achieve for our clients.
In addition, we focus on certain market niches rather than attempting to be all things to all men, to coin a phrase. That has two benefits; as niche experts we hit the ground running, putting us ahead of the pack. In addition, we are able to call on our massive database of past and potential clients to speed up the overall process, reduce days on market, and negotiate the best terms for both Buyer and Seller.
To learn more about the Northern Virginia commercial real estate market and also about the SRE team, please check out our latest market reports. check out our latest market reports. If you would also like to discuss your current plans and specific goals, and to explore how we can help you achieve them, please give us your basic details and we will get right back to you.
*Numbers and statistics are based upon sold commercial properties from 2020 – 2023. Information researched via Costar and internal systems of Serafin Real Estate.