CRE Investor Focus: The Big Picture
What are the best commercial real estate sectors? Which sectors are attracting the most investor interest? Where are the upside opportunities?
CRE is poised for growth. Goldman Sachs forecast a YoY GDP growth of 6.8% this year, inflation is likely to accelerate, positively impacting the cost of debt. Lending rates will remain low, and the Fed Funds Rate will remain stable for the foreseeable future so, all-in-all, principal values should rise. Additionally, as of August 30, the S&P REIT index showed an annual return of 37.99%.
The COVID-19 pandemic has forced us to look again at traditional market sectors. Transitions in CRE were already happening, but they are expected to accelerate. New technology, e-commerce advances, changes in spending habits, the great resignation, the younger generations' focus on more flexibility, more money, and more happiness are driving the increase in remote working. These, in turn, also seem to be generating greater demands for better health care.
These factors and forces are impacting the commercial real estate market, nationally, regionally, and locally. Let us now take a whistle-stop look at four specific CRE sectors before refocusing on our own area.
 Multi-Family
In the top 20 metro areas, multifamily construction is strong. In 2020 Q3, 110,000 units had been delivered, with another 580,000 under construction. Rent collections, overall, and financial performance are strong, making this sector a desirable asset class. Older class B office buildings are being repurposed as residences to provide larger living and work spaces for the modern family.
Industrial
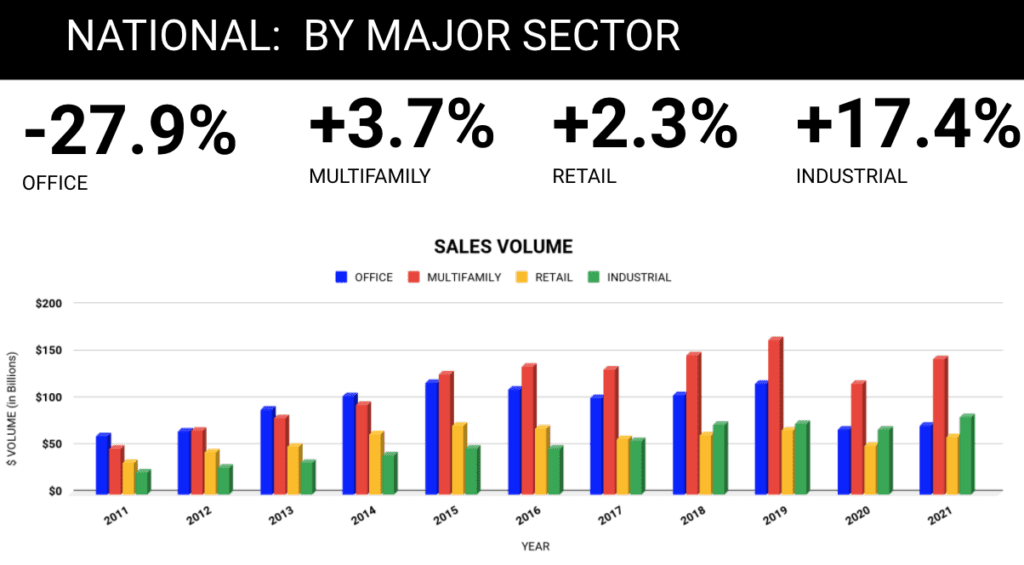
CBRE 's 2021 US Real Estate Market Outlook stated that the industrial sector is one of the most resilient and will be driven by e-commerce demand.Net absorption is expected to reach 250 million SF this year. Retail-to-industrial conversion will accelerate. The strong demand for infill warehouse space in many urban areas is constrained by land availability and high costs. Adaptive reuse of retail property to industrial is expected to continue its upward trend. E-commerce demands new design features, and it may be more advantageous in some urban areas to refit rather than build new ones.
New industrial completions are expected to increase by 21% on top of last year's growth. Inventory control, it seems, is a strong driver since safety stock holdings, needed to avoid inventory disruption, could increase from 15 days to 60 days. Despite low cap rates, domestic and foreign investors are expected to continually inject the necessary capital to ensure supply meets demand. Rent increases are expected to offset any low going-in cap rate.
CBRE also said that almost 80% of industrial markets will see rent rises which will exceed historical averages in the next few years.
Hospitality
COVID-19 saw this sector plummet to a 22% occupancy rate and an 81% decline in RevPar at its lowest point last year. 2021 should see an average occupancy rate climbing to 52%, then 61% in 2022. The long recovery could mean this sector will offer good long-term opportunities. Vacationers and conference organizers are likely to look for locations where guests will find cultural amenities, high quality entertainment, and unique attractions.
Some long-stay properties are being converted to student housing. The increasing demand for lower income homes, which includes hospital workers, teachers, some police officer ranks, and retirees is also likely to create demand for repurposed properties to house them.
Retail
The retail sector has been hit hard, but opportunities exist for the creative mind. Converting mall space to logistics space is a strong possibility. Zoning restrictions and less than ideal locations may limit this opportunity, but this sector could see 5 to 10 MSF a year, and 50 to 100 MSF over the next ten years.
The desire for remote working and living in suburban, rather than urban, settings may well result in higher density residences and a preference for increased walkability ratings. This in turn may result in more last-mile distribution and warehouse centers. These warehouses could also attract on-site shoppers who can both buy at wholesale prices as well as satisfy their buy online, pickup in-store, and ship from store lifestyles.
Now let us turn to the DC Metro area.
The DC Metro Area
The Metro area's investment property market shows 44,700 buildings owned as investment totaling 914 million SF. (19.3 MSF was the amount for sale last year.) Market rent per SF, across all sectors, stands at $29.06 with a market sale price averaging $278/SF, and a cap rate of 6.0%. 12-month occupancy at delivery was 74%. The overall current vacancy rate is 11%.
Looking at sales, we see that the asking price per SF was $177, and the selling price averaged $163.72 (a negative difference of 7.5%) for a total of $14.2B of investment property sold in the past year.
Qs 1 and 4 were the two peak selling quarters in 2020. Q4 sales exceeded $4 billion. 2021's peak quarter in Q2 with sales approaching $2.25 billion. The most active buyer profiles in both years are private investors, followed by institutional buyers. 2021's Q3 has REITs as the major investing group.
If we do a deep dive into the ten subsectors since March 2020, we see total sales equaled $23,551,701,136, broken down into:
- Office
Total sales equaled 343 properties with an average $/SF of $288.25. The actual cap rate averaged 7.59%, and the sold to asking price was 90.54%.
- Flex
Total sales equaled 72 properties with an average $/SF of $234.83. The actual cap rate averaged 7.52%, and the sold to asking price was 93.86%.
- Industrial
Total sales equaled 109 properties with an average $/SF of $117.47. The actual cap rate averaged 7.11%, and the sold to asking price was 104.11%.
- General Retail
Total sales equaled 252 properties with an average $/SF of $262.38. The actual cap rate averaged 6.35%, and the sold to asking price was 91.66%.
- Sports and Entertainment
Only one property was sold. The selling price was $1,600,000, which was 91.43% of the asking price equaling $145.45/SF.
- Multi-Family
Total sales equaled 328 properties with an average $/SF of $235.27. The actual cap rate averaged 5.69%. The gross rent multiplier averaged 8.78. The average price per unit (on 266 properties reported) was $240,679 and the sold to asking price averaged 95.41%.
- Hospitality
Total sales equaled 69 properties with an average $/SF of $225.37. The average rooms per property equaled 136, resulting in an average price paid per room of $147,344. The actual cap rate averaged 7.50%, and the average sold to asking price was 95.91%.
- Vacant Land
219 parcels were sold in the period averaging 35.02 acres for a price of $251,725 per acre. The sold to asking price averaged 98.11% on 78 reported parcels.
- Healthcare
Total sales equaled 23 properties with an average $/SF of $235.95 and an average building size of 52,805 SF. The sold to asking price was 94.49%.
- Specialty
Total sales equaled 78 properties with an average $/SF of $228.65. The actual cap rate averaged 6.44%, and the sold to asking price was 93.51%.
Dulles Area
Let's now focus on an 8-mile radius of Dulles Airport. There are currently 2,297 investment-owned properties totaling 114 MSF. Market rent per SF, across all sectors, stands at $25.39 (87% of DC Metro) with a market sale price averaging $253/SF (91% of Metro), and a cap rate of 6.3% (5% above DC Metro) and 12-month occupancy at delivery was 93.7% (26.6% higher than DC Metro). The overall current vacancy rate is about the same at 10.7%.
The average asking price across all sectors was $174/SF (less than 1% difference) and the selling price averaged $160.08 (-8% from asking price, and 9% below the Metro area average.) 238 properties were sold in an average timeframe of 17.2 months.
2020 Q1 was by far the highest quarter for sales, following 2019 Q4's exceptional record. 2021 Q2 is the best quarter so far, with sales of $500 million. The most active buyer profile in both years is the institutional investor. Overall, national buyers made up 69% of total contracts. Now we will look at each of the 9 subsectors (no sports and entertainment property sales were recorded.) Total sales volume in the period from March 2020 was $3,257,718,185 on a total of 220 transactions.
- Office
Total sales equaled 47 properties with an average $/SF of $276.93. The actual cap rate averaged 7.13%, and the sold to asking price was 96.80%.
- Flex
22 properties sold at an average of $307.26/SF. The actual cap rate on sold transactions averaged 7.4%, and the sold to asking price was 94.02%.
- Industrial
The total number of industrial properties sold was 5, for a total sales price of $29,550,000 at an average $/SF of $21,400. The actual cap rate averaged 6.43%, and the sold to asking price was 77.19%.
- General Retail
15 properties sold at an average $/SF of $359.04 with an average center size of 20,965 SF. The actual cap rate averaged 5.63%, and the sold to asking price was 115.95%.
- Multi-Family
9 properties were sold at an average of $262.44/SF. The actual cap rate averaged 4.14%. The average price per unit was $307,296 across all 9 properties.
- Hospitality
12 properties sold with an average $/SF of $112.94. Rooms per property averaged 113 giving us an average price paid per room of $80,553.
- Vacant Land
56 parcels were sold with an average acreage of 25.42 for a price of $380,417 per acre. Sold to asking price averaged 78.97% on just 7 reported parcels.
- Healthcare
2 properties sold. One was 49,203 SF and the other 102,785 SF. The average $/SF was $78.40.
- Specialty
Total property sales equaled 10 at an average $/SF of $284.40. The actual cap rate averaged 7.0%, and the sold to asking price was 92.49%.
Summary Comment
The COVID-19 pandemic impacted the commercial real estate market. The Delta variant will be with us for the foreseeable future and, perhaps, forever. The economy is set to grow, despite some barriers, and that means commercial investors have ample opportunity to focus on their preferred business sectors.
Traditional markets will continue. They will also change in ways referred to in the initial comments, enabling investors and users to maximize opportunities and capitalize on both social and economic drivers.
The DC Metro and the Dulles Airport areas both show positivity and opportunity across all subsectors. We know what the past 18 months have delivered, let us make the most of the next 18.