

Two years after that global pandemic, commercial real estate in America is on the mend. Commercial real estate is booming as investors lean towards safer investment vehicles in a volatile stock market. Historically, investors use commercial real estate to hedge against inflation and are keen to diversify their holdings. The current monetary policies appear to support economic growth and increase investor confidence.
The commercial real estate sector is set for a booming 2022, riding on the capital gains and momentum gained through 2021. The aftermath of the Covid-19 pandemic will continue to shape the commercial real estate market well into the future.
The evolution of the online and hybrid work environment will continue to draw people away from large cities into smaller markets. The migration to smaller markets creates a sustainable demand for multi-family units. The popularity of online shopping has grown the demand for warehouses, with online retailers driving up the need for warehouses and distribution facilities.
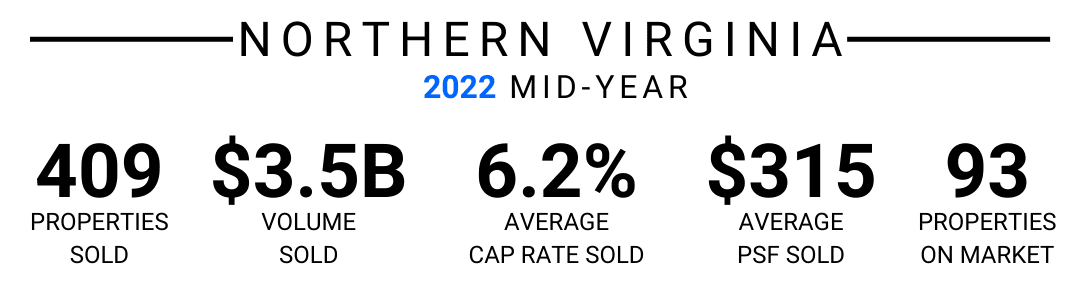
Here’s a look at the Mid-year CRE results for Loudoun, Fairfax, and Prince William Counties. We highlight 2022 activity and discuss the stats from the same time last year.
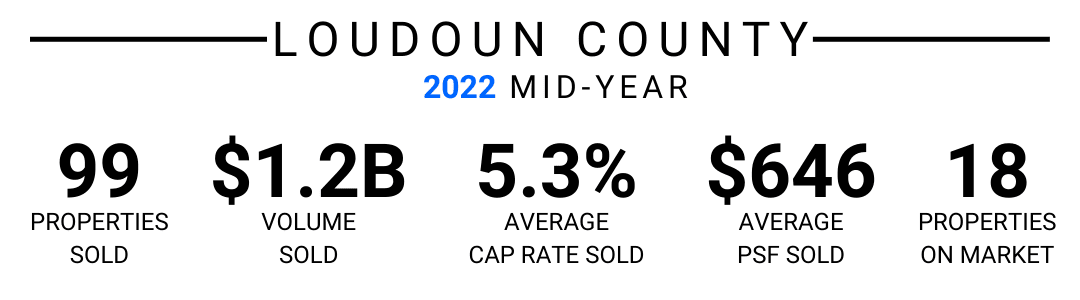
376 properties totaling $3.1 billion were sold in Loudoun County since the same time last year, with an average sale to asking price differential of 7.4%. A total of 899K square footage was sold at an average of $272 per square foot, ranging from $195 to $245.
Detailed Breakdown
- The net delivered SF was 2,391,151, which is almost 50%, down from the 4,531,747 delivered last year.
- The market absorbed 2,729,779 SF, down from 4,885,643 the previous year.
- The annual rent growth was 4.4% and marked an increase from 2.8% the last year.
- The market sale price per SF increased by $17 to $273, up from $256 the previous year.
- The market Cap Rate dropped to 5.76% from 5.81% last year.
Seller/Buyer Volume Breakdown
- Private sellers bought 42% of the sales volume
- User-owners sold 18% of the sales volume
- 67% of sales volume was by national entities, 28% by local entities, and 5% by foreign entities.
- National entities bought 71% of the sales volume while local and foreign entities bought 20% and 9%, respectively.
- Institutions bought 30% of the sales volume, while private buyers bought 37%.
- Private Equity was the least active, buying 9% of the sales volume.
Rent/SF and Vacancy Rates
The daily asking rent per SF was around $21.25, while the daily rent per SF was $23. The direct and sublet rent per SF are tied at $22.25. The direct asking rent was $22, while the sublet asking rent was $22.25.
The daily vacancy rate was at a historic low in June at 4.5%, with only 3.88 million vacant SF reported. At below 5%, the overall vacancy rate was at an all-time low while the occupancy rate was at a historic high, topping 95%.
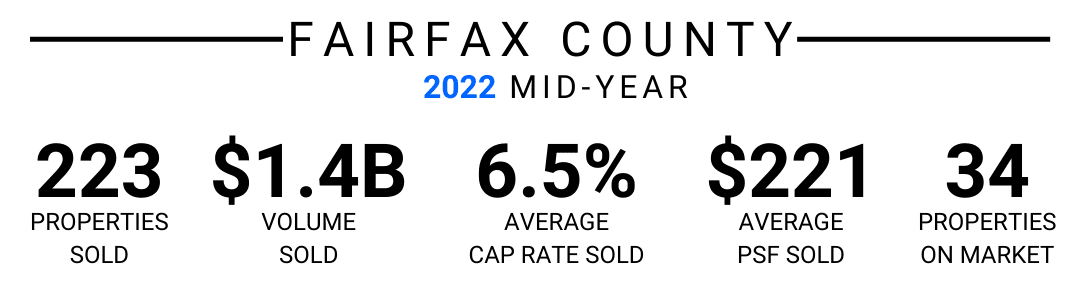
545 properties with a total sales value of $4.8 billion were sold in Fairfax County, with a sale to asking price differential of 7.1%. The total SF available for sale grew to 3.2 million, with an asking price of $313 per SF.
Detailed Breakdown
- The available inventory grew by 0.2% to 206 million SF
- The commercial real estate space under construction grew by 6.1% to 11.9 million SF compared to the 11.2 million the last year.
- The vacancy rate increased to 12.3%, up 0.3% from 12.0% last year.
- The market sale price peaked at $312, up 8.3% from $288 last year.
Seller/Buyer Volume Breakdown
- 45% of the sales were attributed to private buyers
- 23% were attributed to the institutions
- REIT/Public and Private Equity groups bought 11% and 15% of the available assets, respectively.
- Users closed 6% of the sales
- Private entities bought 44% of the available properties
- Institutions and REIT/Public groups bought 24% and 19% of the available assets, respectively.
- Users and private equity groups bought 5% and 8% of the sales volume, respectively.
Rent/SF and Vacancy Rates
The daily asking rent was slightly over $30 per SF, while the direct rent crossed the $31 mark for the first time. The sublet asking rent hovered over $26, while the direct asking rent topped $31 per SF. The sublet rent mirrored the sublet asking rent at about $26.
The daily vacancy rate rose sharply to almost 12% after a steep decline in January. At 12.3%, the vacancy rate is approaching the historical peak of 12.4%, up from 11.8% last year. More than 25 million SF of commercial real estate are vacant as the occupancy rate drops to a near-historic low. The current occupancy rate stands at 87.7%, dropping from 88.2% last year.
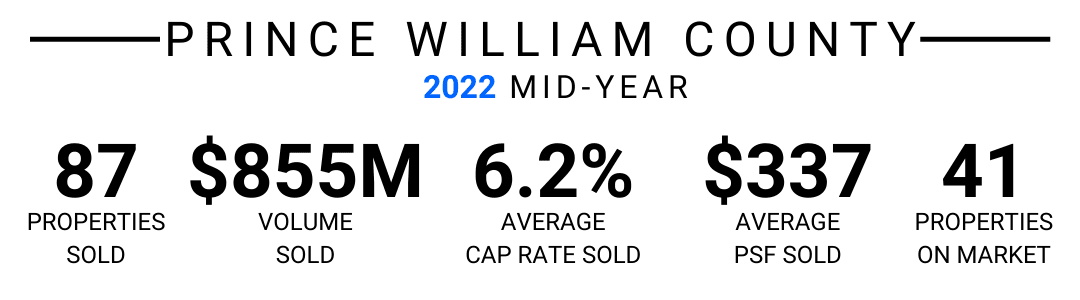
276 properties with a total sales value of $1.8 billion were sold in Prince William County, with a sale to asking price differential of 10.6%. The total SF for sale grew to 1.2 million, with an asking price of $235 per SF.
Detailed Breakdown
- The available inventory grew 0.5% to 52.2 million SF, up from 52.0 million last year.
- The commercial real estate space under construction grew 80.4% to 2.8 million SF, up from 1.5 million last year.
- The market sale price peaked at $301 per SF, up 19.8% from $251 the previous year.
- The market cap rate dropped by 0.2% to 5.4%, compared to 5.6% last year.
Seller/Buyer Volume Breakdown
- Private buyers bought 37% of the sales volume
- 30% of the buyers were institutions
- Users bought 10% of the sales volume
- REIT/Public entities bought 14% of the real estate
- Private Equity entities bought 9% of the assets
- Private entities sold 42% of the assets
- Institutions sold 16% of the asset volume
- REIT/Public entities had a 19% of the sales volume
- Users made up 18% of the sellers
- Private Equity groups sold 5% of the asset
- National entities bought 67%, local 31%, and foreign assets 2% of the available assets.
- National entities sold 61%, local entities 38%, while foreign entities sold less than 1% of their holdings.
Rent/SF and Vacancy Rates
The daily asking rent per SF was $19.50, while the direct rent was slightly higher than $20 per SF. The direct asking rent was about $20, while the sublet asking price was somewhat lower than $18 per SF. The sublet rent was slightly lower than $18.
The daily vacancy rate was 4.2%, while the vacancy rate hit a historic low of 4.2% in 2017. The vacant SF dropped to 2.2 million while the available sublet SF dropped to 218K. The occupancy rate topped 95%, a phenomenon last seen in Q1 2017. There was no perceptible change in the sublet vacancy rate, which remained well below 1%. The direct vacancy rate dropped to 4% from almost 6% last year. The total vacancy rate dropped to 4.2% from 6% the previous year.
Current Listings in Loudoun, Fairfax, and Prince William Counties
Loudoun County CRE Listings for Sale or Lease
- There are 118 properties listed
- The average rent is $22.19 per SF, which is higher than the 10-year average.
- The annual rent growth is 4.4%, higher than last year’s 2.8%
- The market cap rate is 5.76%, down from 5.81% last year.
Fairfax County CRE Listings
- There are 183 properties listed for sale or lease.
- The average rent is $30.19 per SF, which is higher than the 10-year average.
- The annual rent growth is 1.9%, higher than the 0.6% growth last year.
- The market cap rate is 5.79%, which is lower than the typical range of 5.83%
Prince William County CRE Listings
- There are 83 properties listed for sale or lease.
- The average rent is $21.22 per SF, which is higher than the 10-year average.
- The annual rent growth is 5.1%, higher than the 3.8% growth last year.
- The market cap rate is 5.37%, lower than the 5.57% the previous year.
Summary Comment
The national CRE market remains robust, carrying the positive growth from the previous year. The stable local economy creates a strong demand in the CRE market in Loudoun, Fairfax, and Prince William Counties. A diverse range of properties was sold in the first half of 2022. Our recent closing provides insights into the local transactions, while Serafin’s current listings let local investors and user-owners have their pick at the market. Whether you’re in the market for a school building, office, or industrial space or looking to set up an institution in Northern Virginia, we can help. Contact us if you need professional guidance on a specific commercial real estate property.
Resources and Disclosure: Information and data collected from CoStar, LoopNet, and other proprietary sources of Serafin Real Estate Inc.